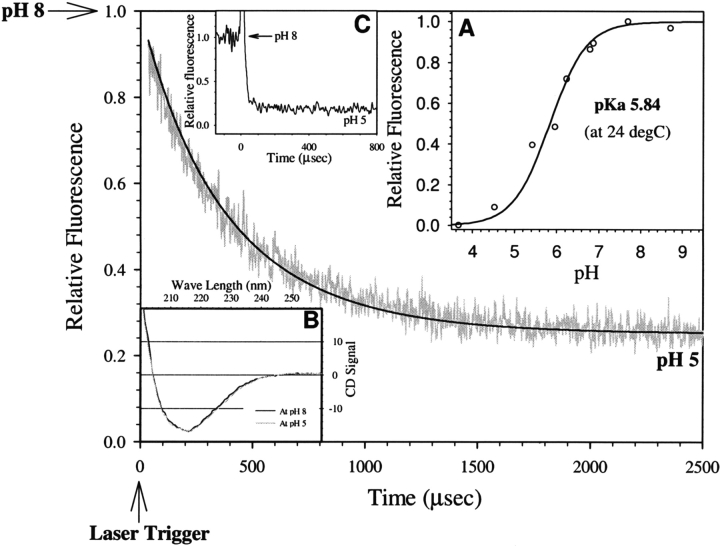
Figure 2.
A typical pH jump trace showing kinetics of protonation of EGFP chromophore upon jumping the pH from 8 to 5. The smooth line was simulated by Equation 5 with rate constants k1 and k−1 as 3.5 × 10⁸ M−1sec−1 and 5.0 × 10² sec−1, respectively. (Inset A) pH titration curve of fluorescence intensity of EGFP. (Inset B) Circular dichroism spectra of EGFP at pH 8 and 5 as shown by black and gray continuous lines, respectively. (Inset C) Result of pH jump in fluoresceinlabeled bovine serum albumin (with experimental conditions same as in EGFP) demonstrating rapid (<10 μsec) protonation of surface-labeled fluorescein.

