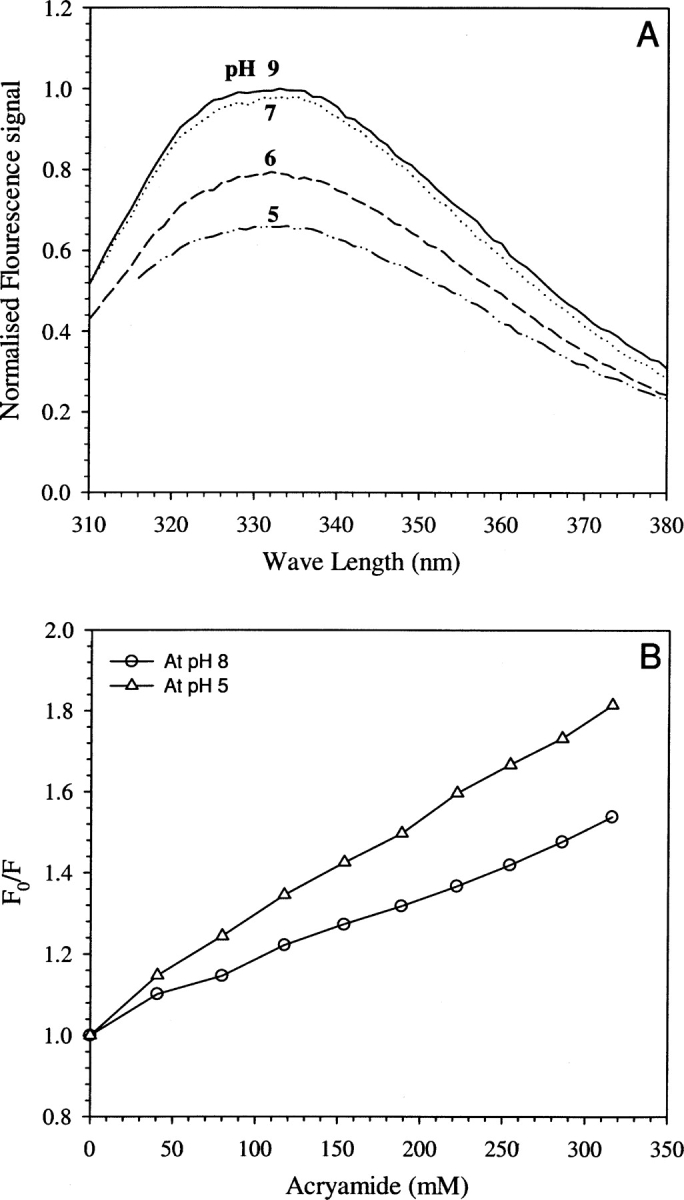
Figure 6.

(A) Fluorescence emission spectra of tryptophan in EGFP showing the decrease in fluorescence intensity as a function of pH (9–5). (B) Stern–Volmer plots of steady-state fluorescence intensity showing the quenching of fluorescence by acrylamide at pH 8 (open circles) and at pH 5 (open triangles).
