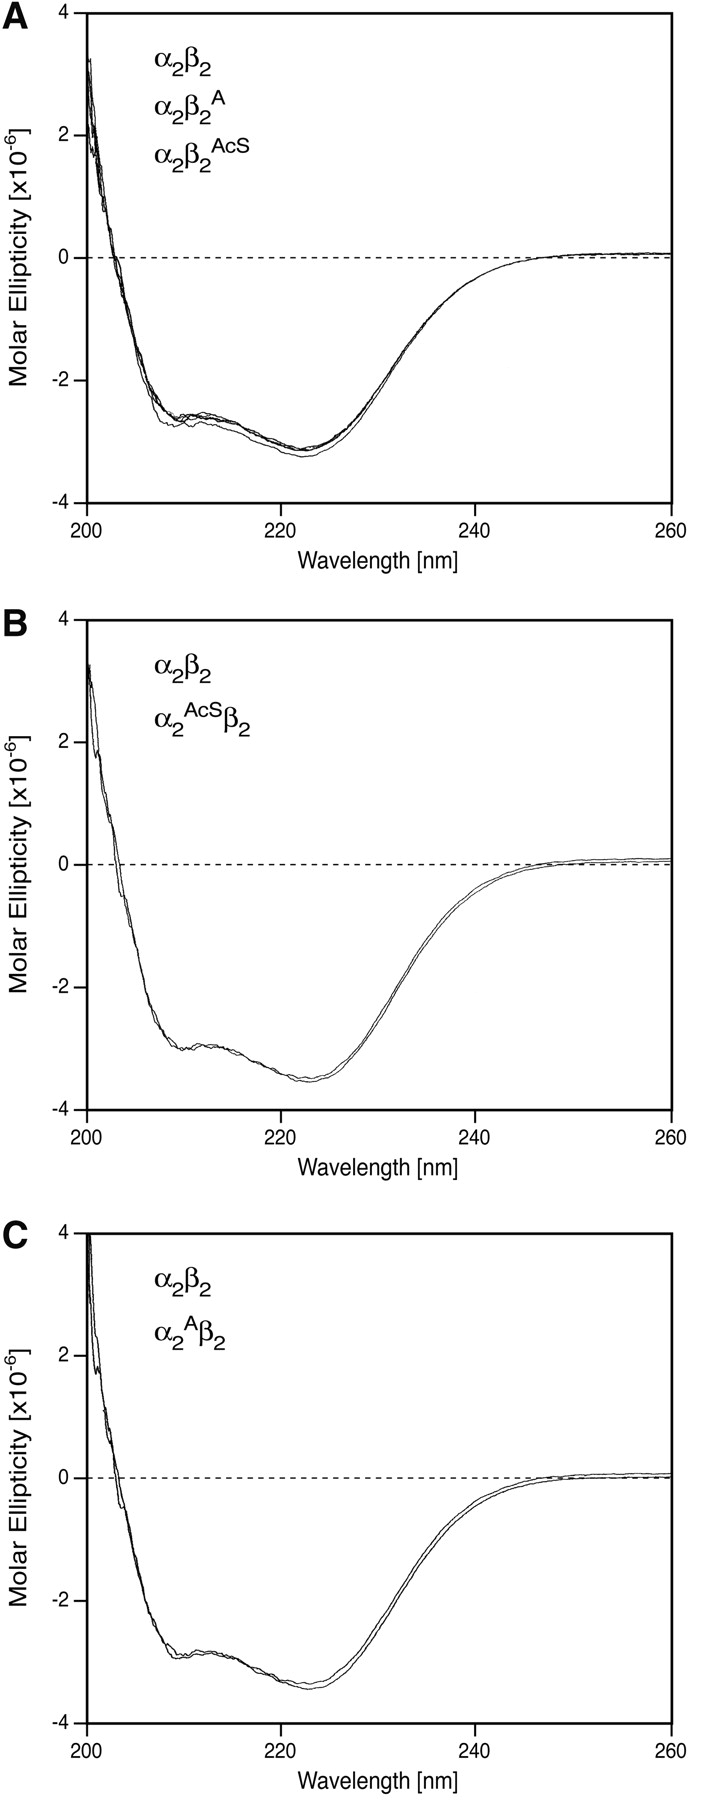
Figure 3.

Circular dichroism spectra were recorded as described in the text. An Hb concentration of 10 μM as the tetramer was used in the far-ultraviolet region. (A) Samples α2β2, α2β2A, and α2β2AcS; (B) samples α2β2 and α2AcSβ2; (C) samples α2β2 and α2Aβ2.
