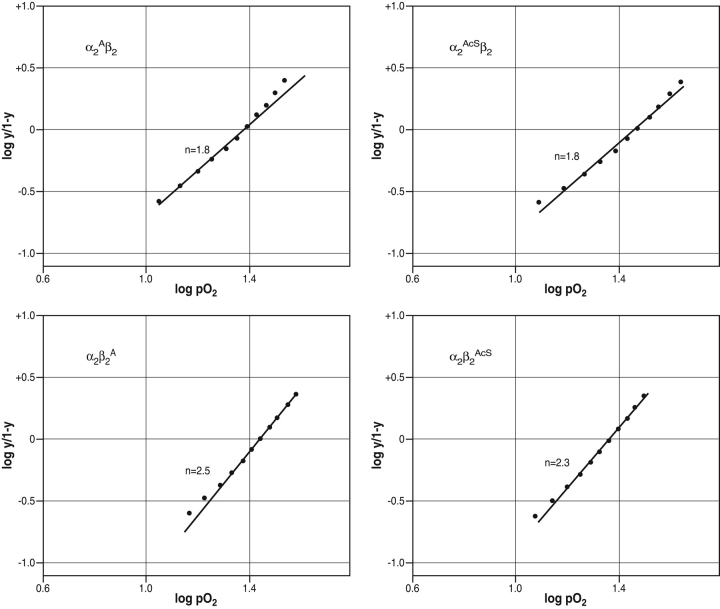
Figure 6.
Hill Plots for N-terminal substituted mutant hemoglobins. The samples are identified on each panel: (upper left) α2Aβ2, (upper right) α2AcSβ2, (lower left) α2β2A, (lower right) α2β2AcS. These Hill plots were calculated from the O2-binding curve in the presence of 2,3-DPG. The points on each line were read from the HemOScan chart paper at each 5% O2-tension between 20% and 70% O2 saturation. The best fit line shown was then drawn through these points with weighting on the mid-range values. These data are from the O2-binding data in the presence of 2,3-DPG at pH 7.5. A similar lowering of the Hill coefficient for the N-terminal α-subunit substitutions was found for the O2-binding data for Hb alone and for Hb with chloride.

