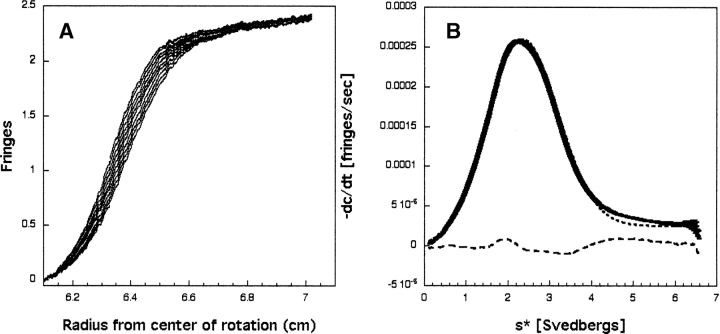
Figure 1.
(A) Representative interference scans for the Grb7-SH2 domain. Data were acquired at 1-min intervals. For clarity, every third scan is shown from a sedimentation velocity run at 50,000 rpm and 20°C, and starting with a run time of 2 h. (B) Shown are dc/dt data for the Grb7-SH2 domain from scans taken 1 min apart. The solid line (showing error bars) represents the average dc/dt. The dotted line represents the best-fit to a single species, and the dashed line indicates the residuals of the fit. The rms deviation for this fit is 5.85 × 10⁻⁶.

