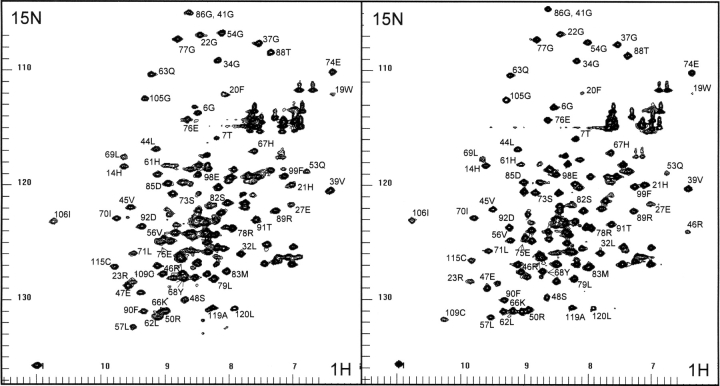
Figure 2.
The proton-nitrogen (1H-15N) correlation spectra of the unliganded Grb7-SH2 domain (left panel) and the Grb7- SH2/pY1139 complex (right panel) are shown. The F2 (X-axis) labels represent amide and Gln/Asn side chain proton resonances, and F1 (Y-axis) labels represent the attached nitrogen resonances.

