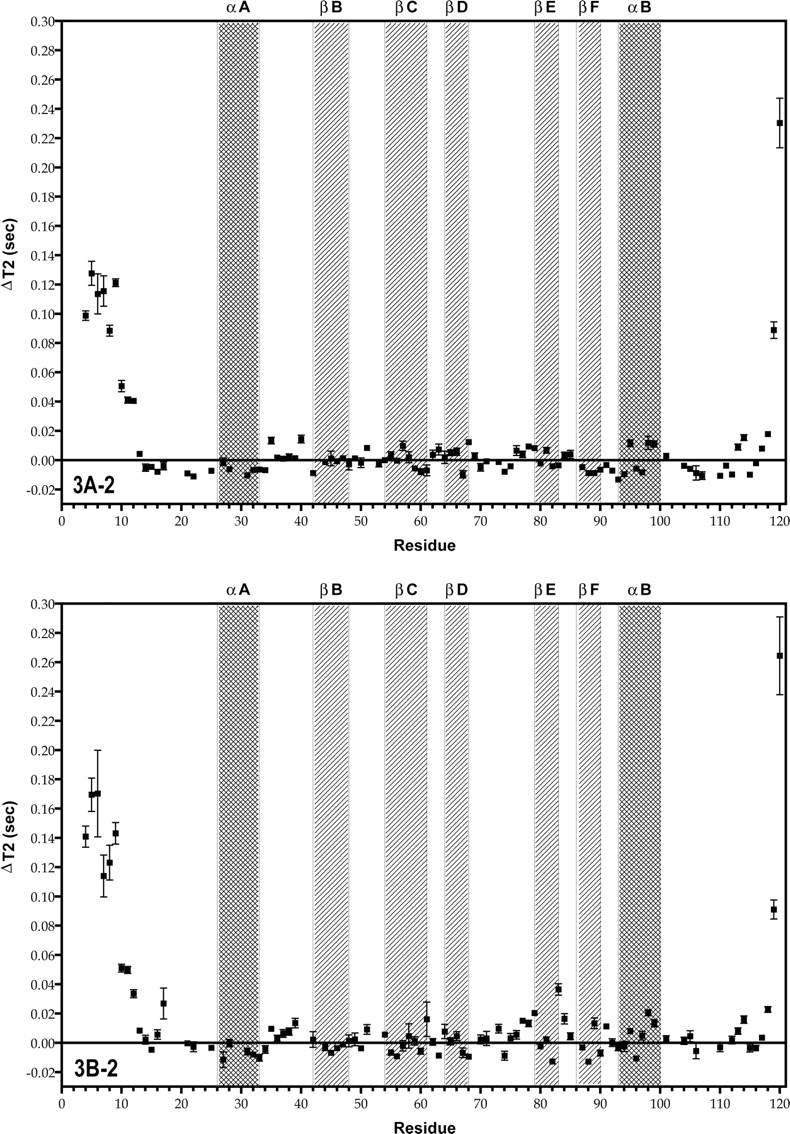
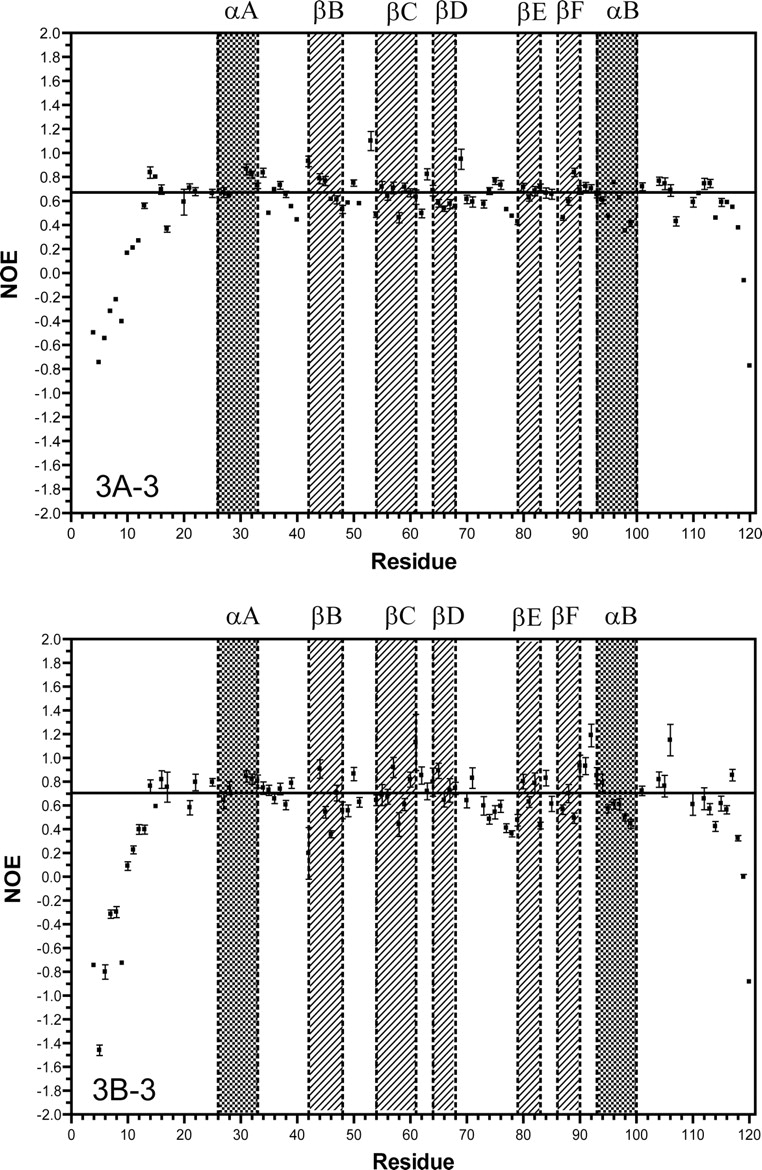
Figure 3.


Plots of T1, T2, and NOE as a function of residue number for the free human Grb7-SH2 domain (A1–3), and the Grb7-SH2/pY1139 peptide complex (B1–3), measured at 500 MHz. For the T1 and T2 measurements, the data are represented as the difference (Δ) in the T1 or T2 value from the average T1 or T2 value for the protein domain (described in the text). The average values for the T1, T2, and NOE are represented in the plots by a solid horizontal line. The secondary structural regions of the Grb7-SH2 domain are indicated by filled squares and labeled accordingly.
