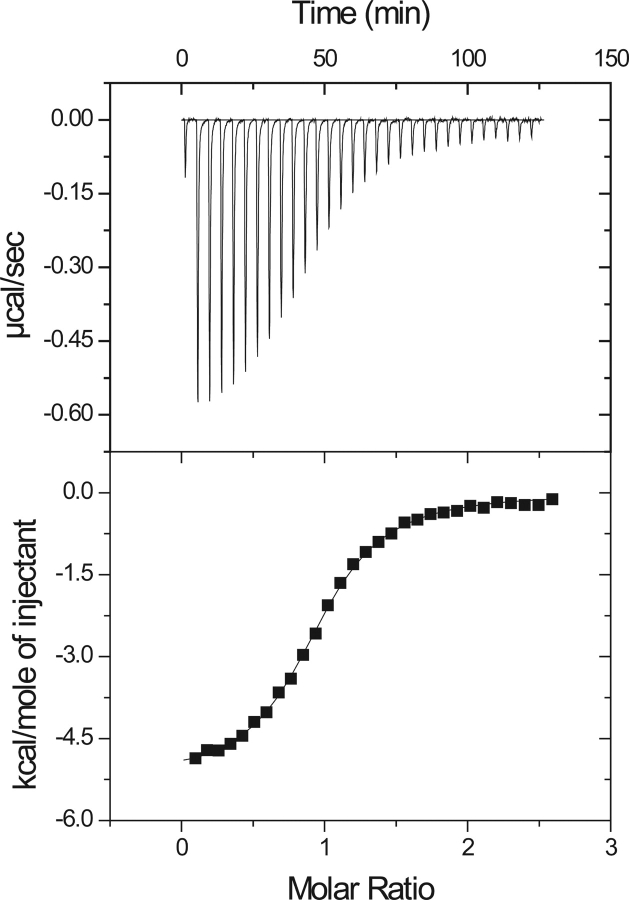
Figure 5.
(Top) Exothermic heats of reaction (μcal/sec) measured for 30 injections of the pY1139 peptide into a Grb7-SH2 sample. (Bottom) The solid line is the best fit to the data for a single binding site model using a nonlinear least squares fit to solve for n (number of binding sites), Kb (equilibrium binding constant), and ΔH (change in enthalpy of reaction), and reported in Table 2.

