Figure 4.
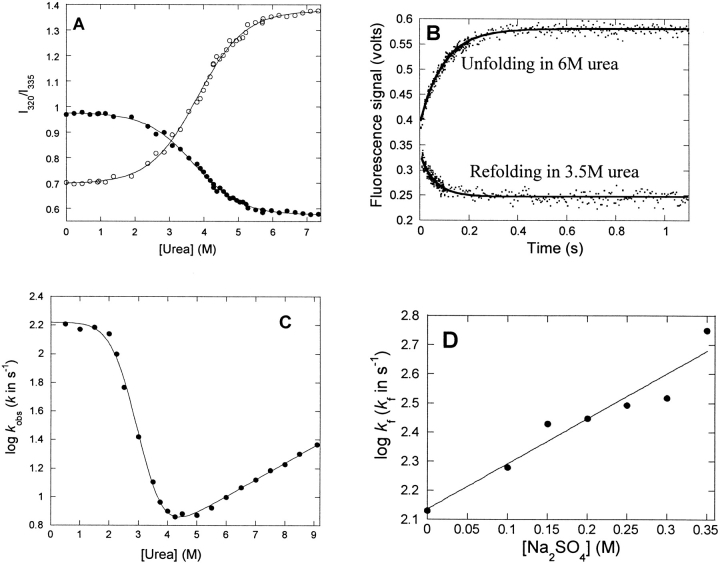
Equilibrium and kinetic stability of p25α. (A) Equilibrium denaturation of p25α in urea, followed by the ratio of the emission intensities at 327, 335, and 355 nm.•, 327/335 nm; ○, 355/335 nm. (B) Time profiles of unfolding and refolding of p25α followed by stopped-flow. Both time profiles are fitted to a single exponential decay with offset. (C) Log of the observed rate constants of folding and unfolding of p25α vs. [urea]. The data are fitted to a three-state model (D ↔ I ↔ N) (Scheme 1). Results are given in Table 1. (D) Effect of [Na2SO4] on the log of the refolding rate in 0.5 M urea, where the intermediate accumulates transiently. The rise in refolding rates with [Na2SO4] is consistent with the scenario that the intermediate is on-pathway.

