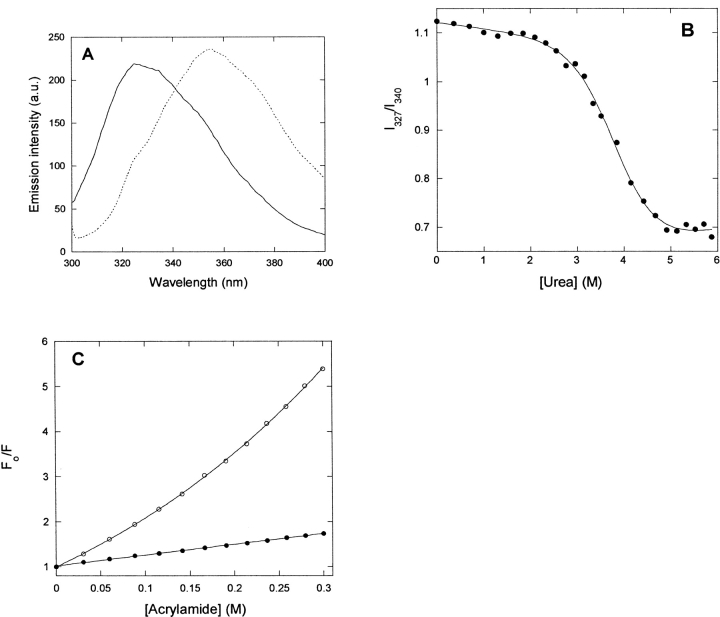
Figure 6.
Biophysical properties of p25αΔ3-43. Data summarized in Table 1. (A) Fluorescence emission spectra of native (solid line) and denatured (stippled line [5 M urea]) protein. (B) Equilibrium denaturation in urea, followed by the ratio of the emission intensities at 327 and 340 nm. (C) Stern-Volmer plot of the quenching of native (•) and denatured (○ [5 M urea]) protein.

