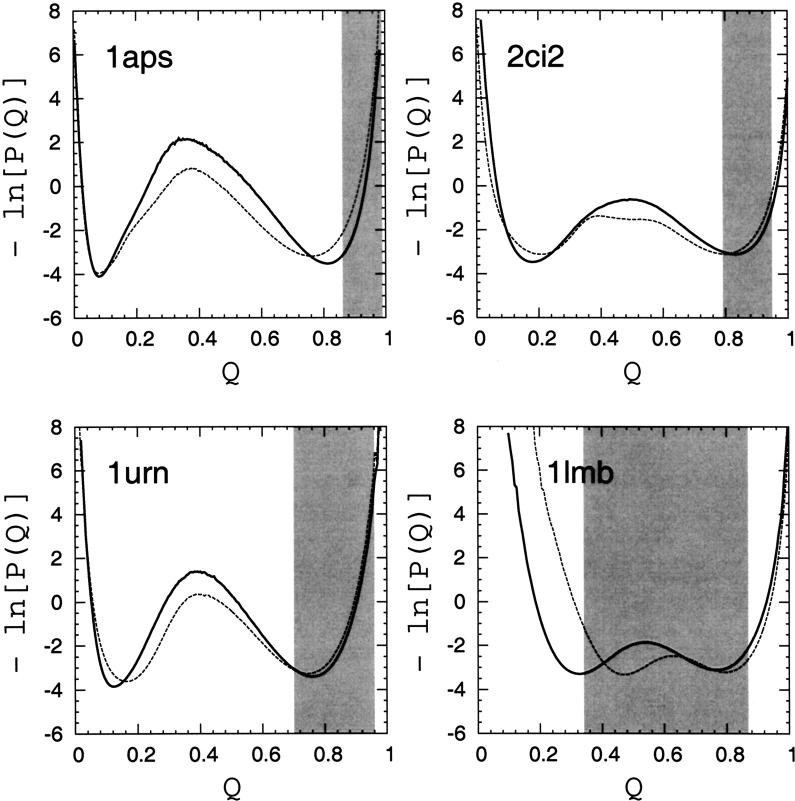
Figure 7.
Free-energy profiles for the four proteins are given by the negative logarithm of the conformational distribution P(Q) in Q, obtained in this study by simulations of native-centric models (Kaya and Chan 2003a) at T ≈ Tf. Results from two native contact sets are shown: (1) contact pairs are defined by native Cα–Cα distance rnij<8 Å (dashed curves); and (2) contact pairs are defined by the shortest spatial separation between non-hydrogen atoms in the two amino acid residues as described by Chavez et al. (2004) and in the text (solid curves). For comparison with the hypothetical TSM picture, the range of variation of 〈Q〉 of the corresponding native topomers across different (lc, rc) criteria (Table 3) is indicated by the shaded areas.

