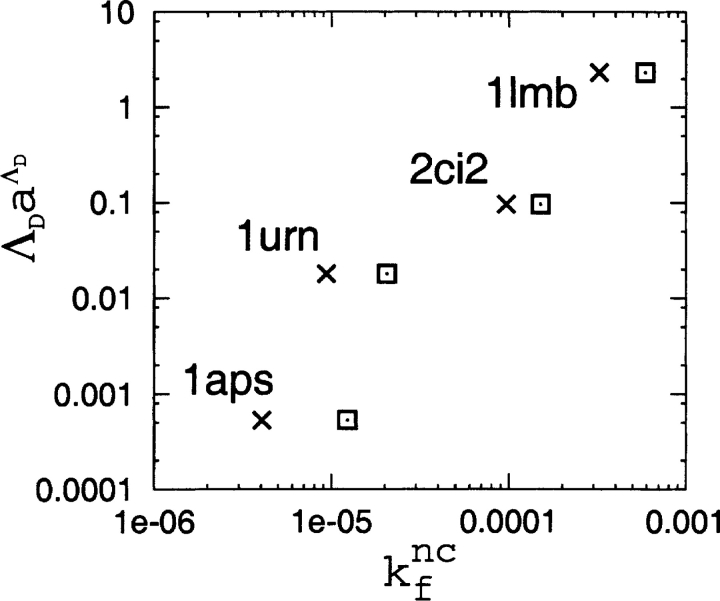
Figure 8.
Comparison between the TSM quantity ΛDaΛD (a=0.86) (Makarov and Plaxco 2003) of the four proteins and the corresponding folding rate kf nc computed in this study from direct kinetic simulations of the native-centric Langevin dynamics models at each model’s Tf. Results for kf nc denoted by × and ⊡ are, respectively, for the native contact sets (1) and (2) specified in the caption for Fig. 7 ▶.

