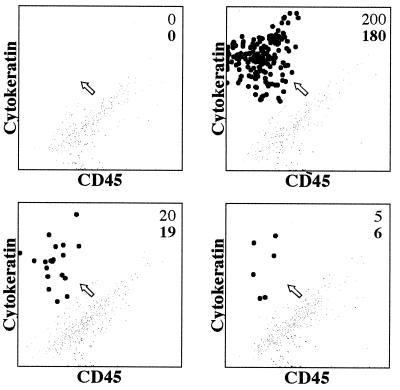
Figure 1.
Flow cytometric analysis of mixtures of blood and breast carcinoma cells. Various numbers of SKBr3 breast carcinoma cells (top figure in the upper righthand corner of each dot plot) were added to 2.5 ml of normal peripheral blood. The tumor cells were enriched by using ferrofluid-coated with anti-EPCAM and then stained with a combination of anti-cytokeratin (CAM5.2 mAb conjugated to phycoerythrin) shown on the y axis and anti-CD45 mAb conjugated to peridinin chlorophyll protein (x axis). Only nucleated cells were recorded based on the nucleic acid staining. The cluster of tumor cells (black dots) is identified readily based on its high cytokeratin expression and CD45 negativity (CD45+ are the gray dots). An arrow points to the putative epithelial cell cluster. The number of the recovered tumor cells also is shown (bottom figure in the upper righthand corner of each dot plot).

