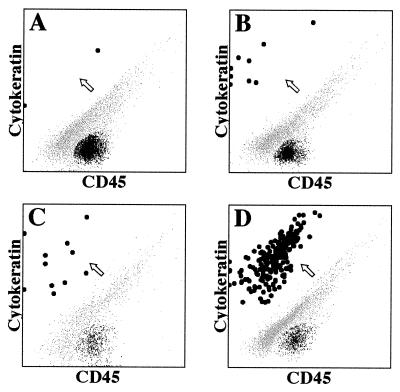
Figure 2.
Flow cytometric analyses of blood samples from patients and controls. These are representative examples of the data from the 46 patients and controls (Table 1). Shown are 10-ml blood samples from a control that shows two epithelial cells (A), from a patient with organ-confined breast carcinoma (9 cells, B) or organ-confined prostate carcinoma (11 cells, C), and from a patient with metastatic breast carcinoma (a very large tumor load, D). An arrow points to the cluster of putative epithelial cells (large black dots). Leukocytes are small black dots, and debris is shown as small gray dots.

