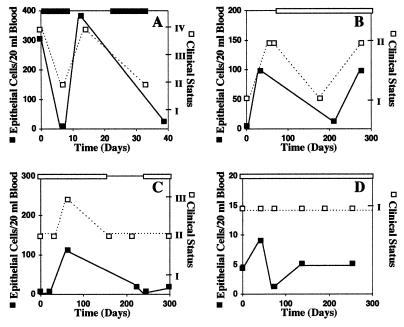
Figure 4.
Changes in blood levels of breast carcinoma cells reflect changes in clinical status. The dark line with darkened squares represents blood levels of epithelial cells and the dotted line with open squares represents the clinical status. The darkened bar on top indicates the length of time for high dose chemotherapy, and the open bar represents the length of time for maintenance chemotherapy. The numbers for clinical status represent the following: I, no evidence of disease; II, stable disease; III, advancing disease; IV, life-threatening disease.

