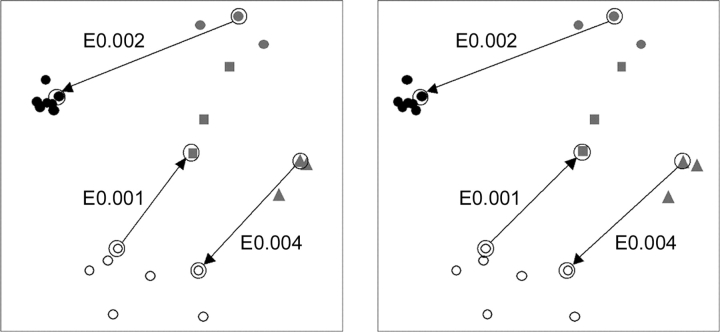
Figure 3.
Euclidian distance mapping and evolutionary connections. The stereo plot represents the first three dimensions of a maximal scatter of points in multidimensional space. The data points correspond to the sequences shown in Figure 2 ▶, with the scatter approximating evolutionary distances. The symbols correspond to grouped sequences: black circles (Group I Dak); gray circles (Group IIA EIIA-dak); gray squares (Group IIB EIIA-transcription antiterminator); gray triangles (Group IIC EIIA-man); and open circles (Group III, DegV). The arrows stem from data points corresponding to query sequences that when used in PSI-BLAST establish evolutionary links across families to the data points representing sequence hits. Arrows are labeled with the PSI-BLAST E-values of initial hits across families.

