Figure 7.
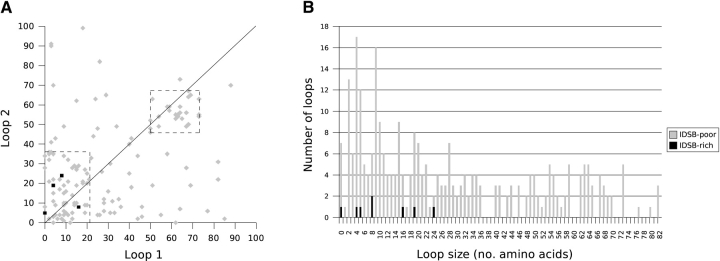
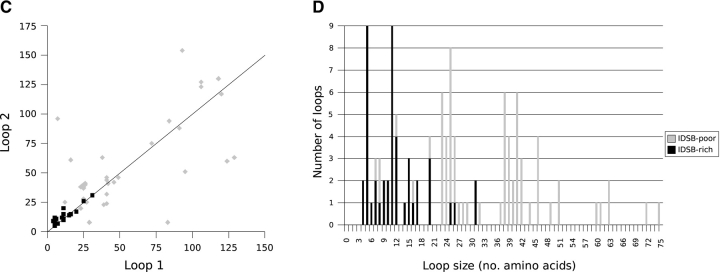
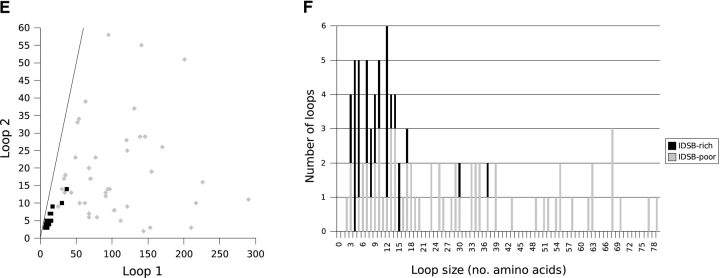
Loop size associations, by bonding pattern, for IDSB-rich and -poor chains with two IDSBs. The relationship between the size of the first (i.e., closer to the N terminus) and second (i.e., closer to the C terminus) loops in nonhomologous protein chains with 1-2 3-4 (A, B), 1-3 2-4 (C, D), and 1-4 2-3 (E, F) IDSB bonding patterns. The solid line represents Loop 1 = Loop 2 (y = x). The dashed squares in A highlight two clusters in loop lengths.


