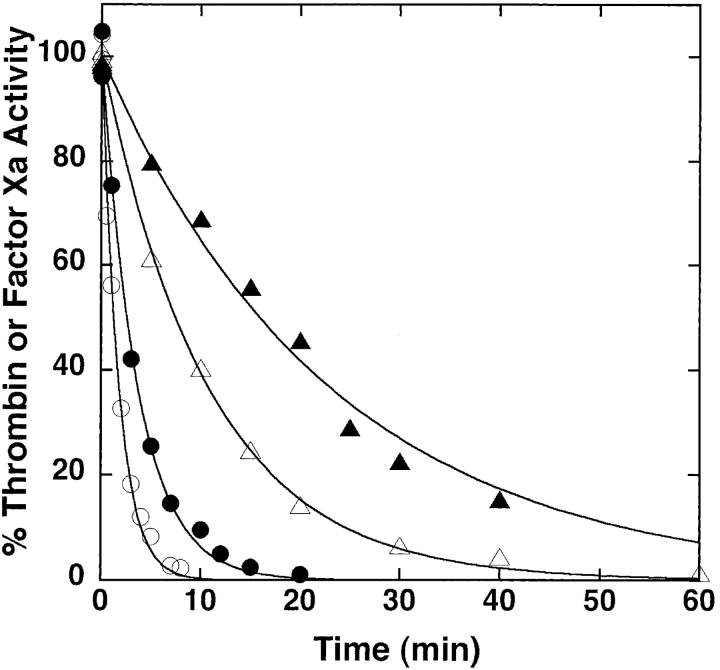
Figure 3.
Kinetics of P1 Arg crmA inhibition of thrombin and factor Xa. Shown are the reactions of 0.5 (•) or 1 μM (○) P1 Arg crmA with 10 nM factor Xa or of 2.5 (▴) or 5 μM (▵) P1 Arg crmA with 10 nM thrombin. Residual enzyme activity was measured after the indicated reaction times by dilution into chromogenic substrates as in Figure 1 ▶. Activities are normalized to those measured in the absence of inhibitor. Solid lines are fits to a single exponential function with zero endpoint.

