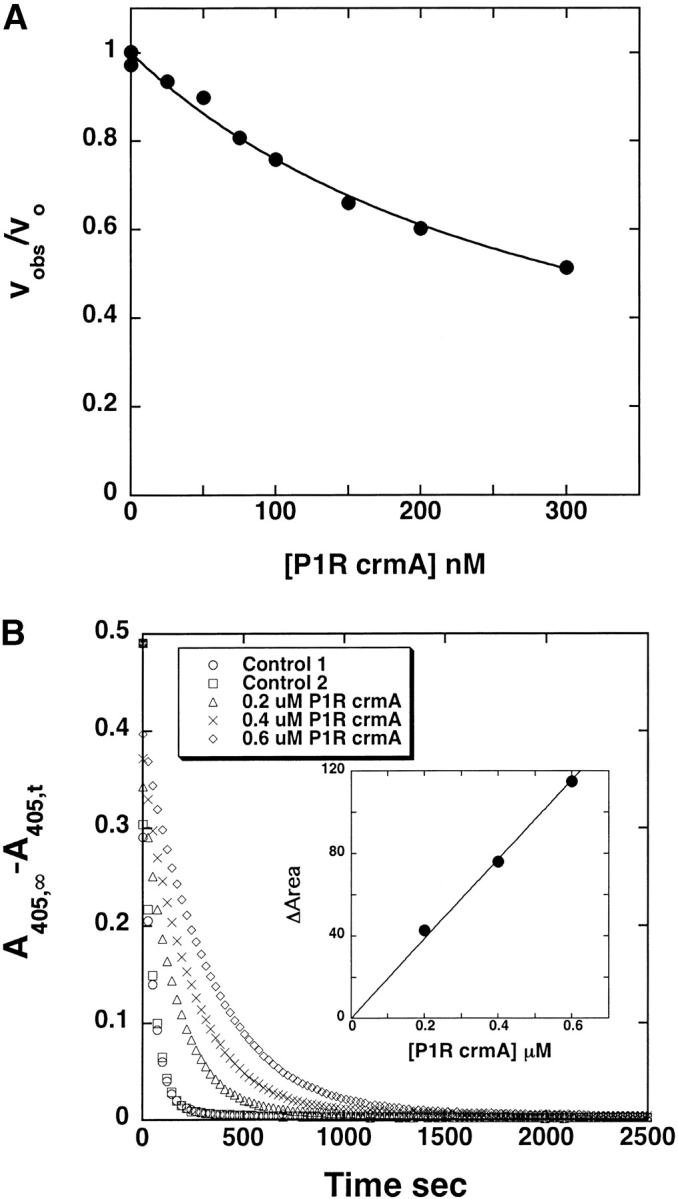
Figure 5.

Determination of KM and kcat values for trypsin cleavage of P1 Arg crmA. (A) Dependence of the initial rate of cleavage of 100 μM S-2222 by 0.5 nM trypsin on the concentration of added P1 Arg crmA competitor substrate. The solid line represents the computer fit to the hyperbolic equation for inhibition of S-2222 hydrolysis by a purely competitive substrate interaction as given in Materials and Methods. (B) Full progress curves for the hydrolysis of 50 μM S-2222 by 5 nM trypsin in the absence and presence of the indicated concentrations of P1 Arg crmA with the ordinate axis depicting the disappearance of substrate. The inset shows the proportional dependence of the change in area under the curves measured in the presence and absence of competitor as a function of the competitor P1 Arg crmA concentration, from which the kcat for trypsin cleavage of P1 Arg crmA was determined as described in Materials and Methods.
