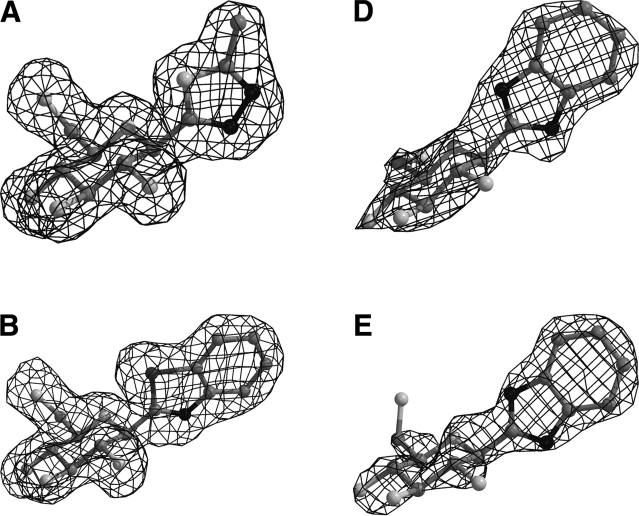
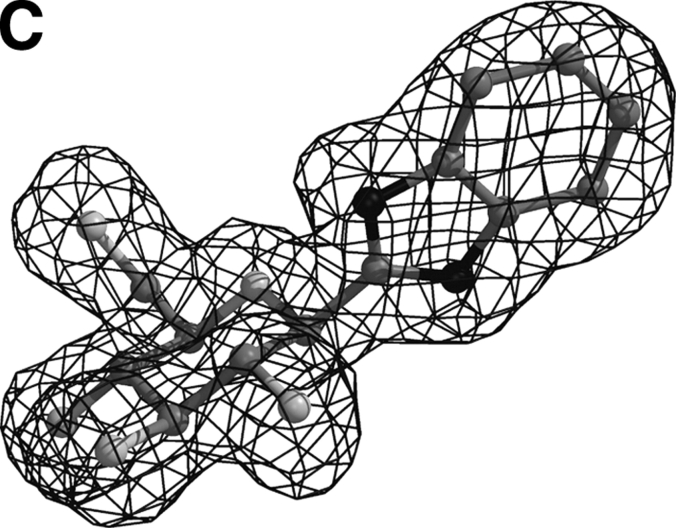
Figure 2.
Diagrams of the Fo - Fc electron density maps, contoured at 3σ, for the bound methyl-oxadiazole (A) and benzothiazole (B) at the catalytic site, and benzimidazole at the catalytic (C), indole (D), and the novel binding site (E). Electron density maps were calculated using the standard protocol as implemented in CNS v1.1 (Brünger et al. 1998) before incorporating ligand coordinates.


