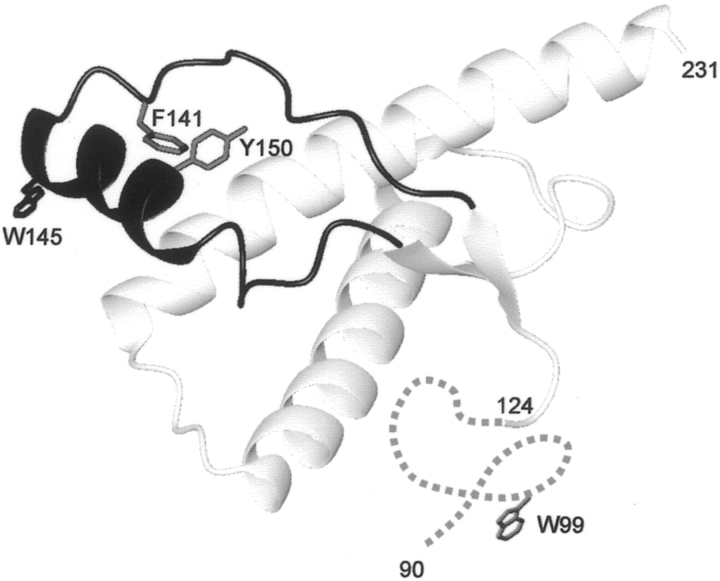
Figure 1.
Ribbon diagram of the 3D structure of SHaPrP90–231 showing the location of the two native Trp residues (W99, W145) and the residues (F141, Y150) that were substituted for a Trp. The 132–160 region is highlighted in dark gray. The figure was produced using MOLMOL (Koradi et al. 1996). The N-terminal segment of residues 90–123 is disordered and displayed schematically as a dotted line.

