
Figure 6.
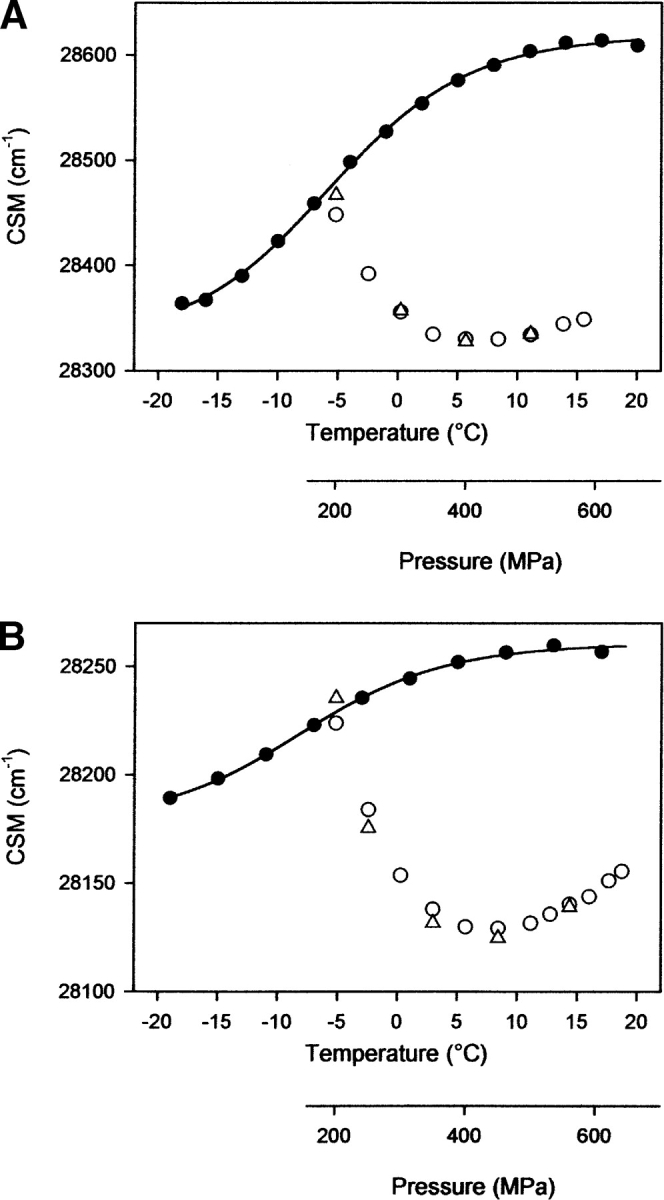
Pressure-assisted cold unfolding (filled circles, temperature scale), and pressure unfolding at -5°C (open circles, pressure scale) and refolding (open triangles, pressure scale) curves for Y150W (A) and F141W (B) variants. The protein conformational changes were recorded by the changes of fluorescence emission spectra, reported as center of spectral mass (CSM). Protein concentration was 0.3 mg mL−1 in sodium acetate buffer, 20 mM (pH 4.0).