Figure 1.
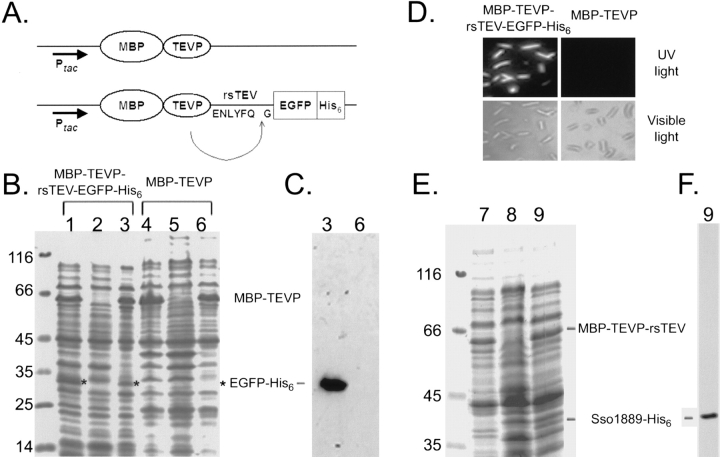
In vivo cleavage of MBP-TEVP-rsTEV-EGFP-His6 and MBP-TEVP-rsTEV-Sso1889-His6 fusion proteins. (A) Schematic map of the MBP-TEVP and MBP-TEVP-rsTEV-EGFP-His6 fusion protein expression vector. The amino acid sequence of the TEVP recognition site is indicated. Ptac: The tac promoter is used for IPTG induction. Solubility tests were carried out as previously described (Shih et al. 2002). Samples of the total protein and soluble protein fractions were separated by 10% SDS-PAGE under reducing conditions and stained with Coomassie blue (B,E): lanes 1, 4, and 7, whole-cell lysates of E. coli cells induced with IPTG; lanes 2, 5, and 8, whole-cell lysates of uninduced cells; lanes 3, 6, and 9, soluble proteins from IPTG-induced cells. The molecular weight standards are shown on the left. MBP-TEVP is indicated by a bar on the right. EGFP-His6 protein bands are marked by an asterisk (*) on the right. Soluble proteins from IPTG-induced cells (lanes 3,6,9) were analyzed by Western blot using the anti-His6 antibody to verify EGFP-His6 (C) and Sso1889-His6 (E). Note that both EGFP-His6 and Sso1889-His6 are completely cleaved from the MBP-TEVP-rsTEV-EGFP-His6 and MBP-TEVP-rsTEV-Sso1889-His6 fusion proteins, since the latter could not be detected by Western blot. (D) Visualization of EGFP-His6 in the IPTG-induced E. coli cells. Images of living cells were taken by a fluorescence microscopy using either UV light or visible light.

