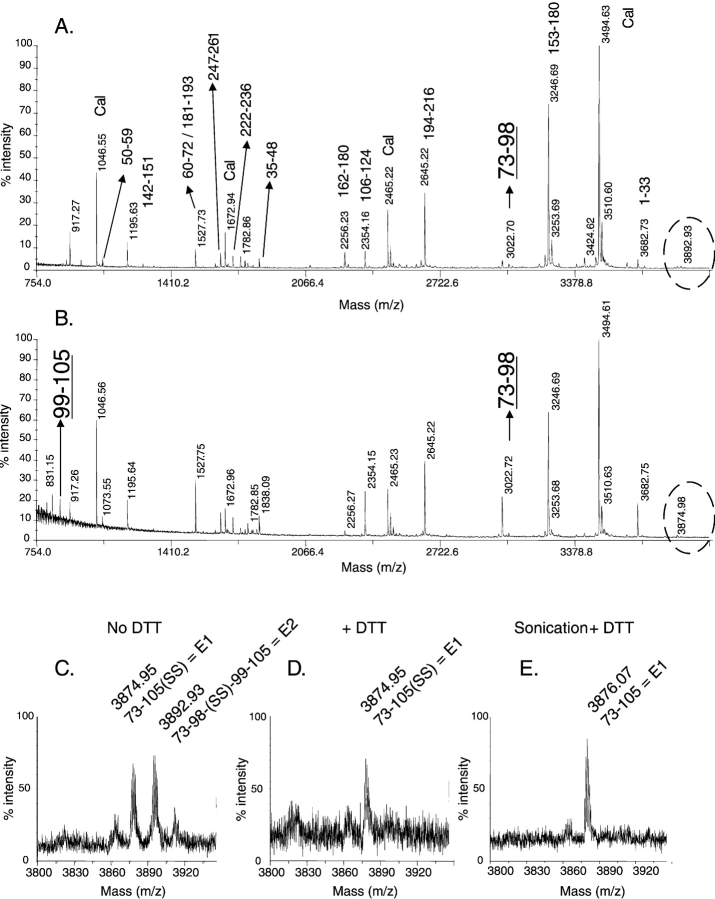
Figure 6.
MALDI-ToF mass spectra of the endo-LysC digest of calbindin without (A) and with DTT (B). Close-up views of the spectra of the 73–105 peptide (fragment E1) and of the 73–98/99–105 disulfide-linked peptide (fragment E2), marked by dotted circles in (A) and (B), without DTT reduction (C), after reduction with DTT (D), and after sonication and reduction with DTT (E).

