Figure 7.
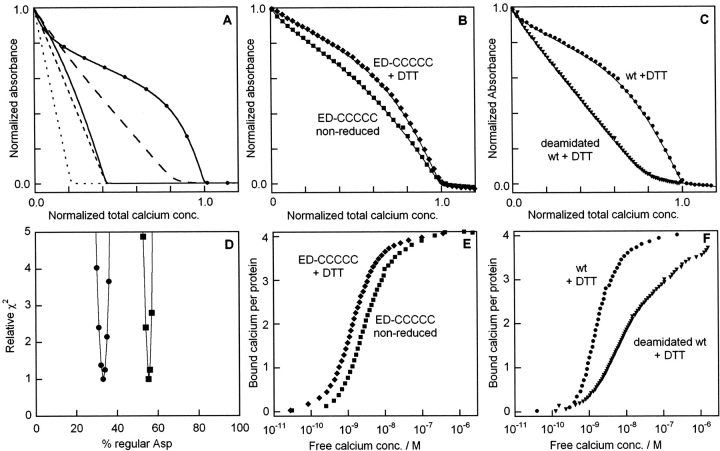
Ca2+-titrations of quin2 in the presence of calbindin. (A) Simulated curves for 25 μM quin2 and 25 μM protein, for five cases where the protein contains: (1) no Ca2+-binding site (dotted line); (2) one site with the same affinity as quin 2 (dashed line); (3) one site with twofold (0.3 log units) higher affinity than quin 2 (solid line); (4) three sites with same affinity as quin 2 and no cooperativity plus one site that is 100-fold weaker (line with long dashes); (5) four sites with strong positive cooperativity and on average twofold higher affinity than quin 2 (solid line with symbols). (B) Experimental data for ED-CCCCC in reduced (♦) and nonreduced (▪) forms, with fitted curves as solid lines. (C) Experimental data for wild type (•) or deamidated wild type (▾) under reducing conditions, with fitted curves as solid lines. All data are obtained in 2 mM Tris/HCl, pH 7.5. Reduced samples (prepared as described in the Methods section) contain 1 mM DTT. (A–C) The absorbance is normalized such that 1.0 corresponds to apo quin 2 and 0.0 to Ca2+bound quin2. The total calcium concentration is normalized such that 1.0 corresponds to the quin 2 concentration plus four times the protein concentration. (D) Relative error square sum (χ2) obtained for different fractions of the form with regular Asp (expressed in percent) for the cases of one (line with squares) or two (line with filled circles) high affinity sites in the form with iso-Asp. (E,F) Transformed data from panels B and C, respectively, to display the average number of bound Ca2+ ions per protein as a function of free Ca2+ concentration.

