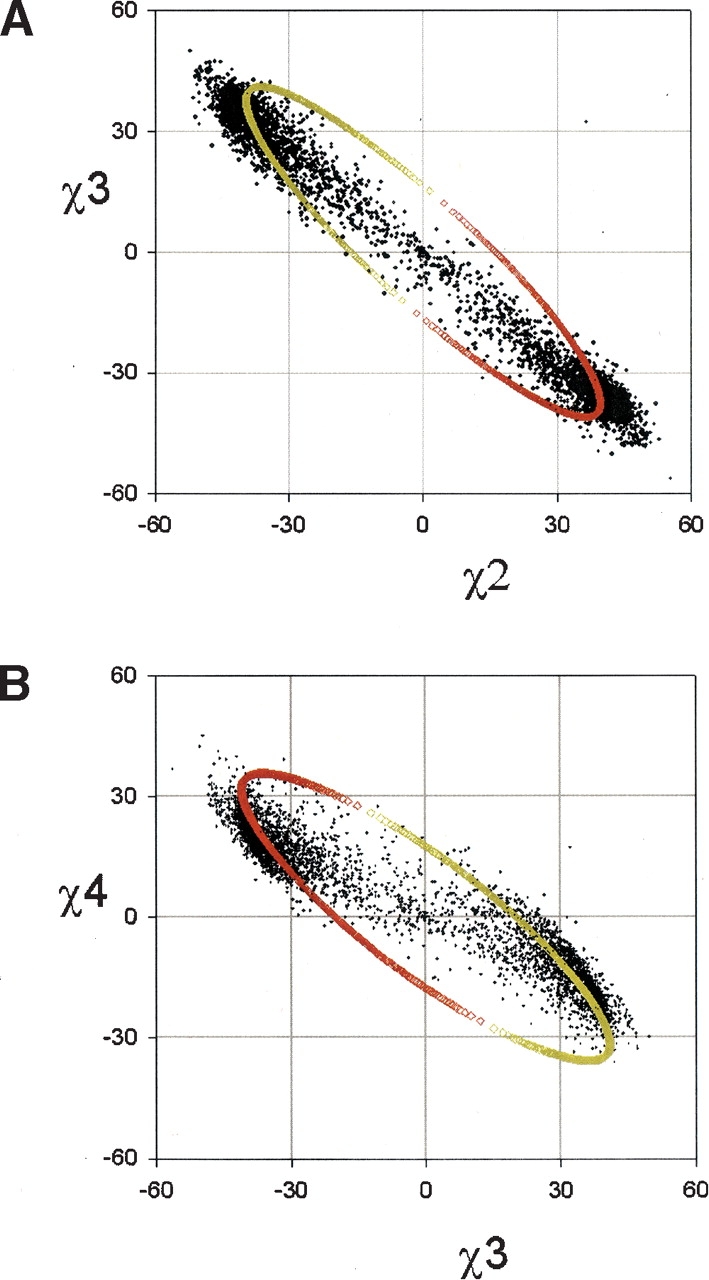
Figure 3.

Correlations in the χ torsions. (A) χ3 vs. χ2; (B) χ4 vs. χ3. The model curve passes through the two lobes of high density, where it is clear that the slope of the two lobes are determined by the model curve and is different to the curve formed by the sparse density of points in between. The colors of the curve represent the UP pucker (red) and the DOWN pucker (yellow).
