
Figure 4.
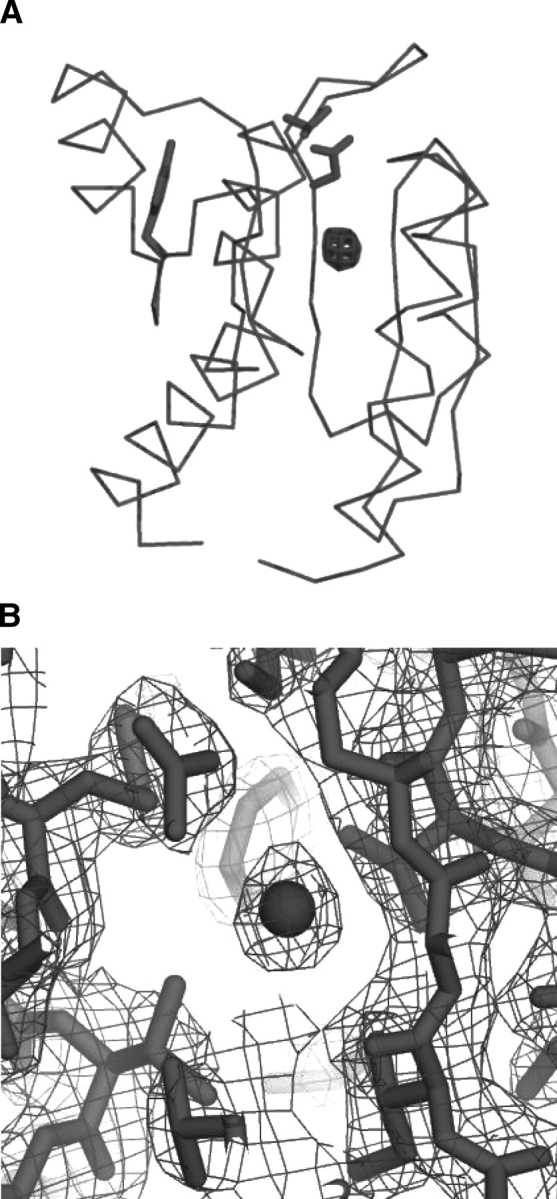
X-ray crystal structure of BeF3−-activated CheY bound to xenon. (A) An Fobs–Fcalc difference electron density omit map (mesh) contoured at 10σ with the xenon atom removed from the model. Electron density from the xenon atom is clearly visible just below the active site inside the H1-β3 cavity. (B) A 2Fobs–Fcalc electron density map (mesh) of the H1-β3 cavity contoured at 1.5σ showing the xenon atom (sphere) and the surrounding residues (sticks).