
Figure 5.
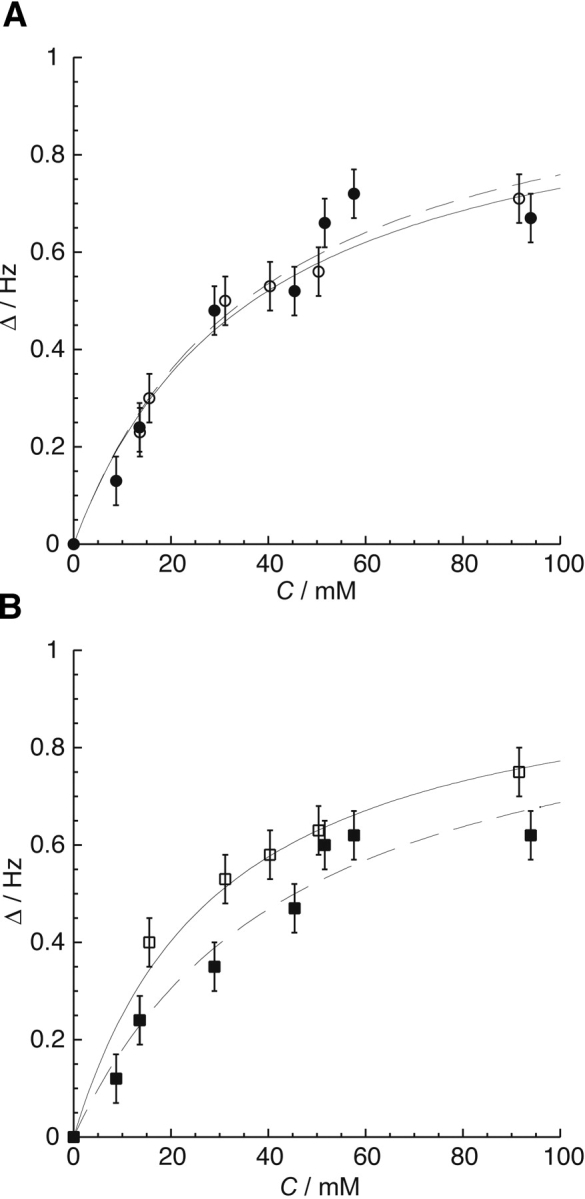
(A) The average of the normalized change in chemical shift (Δ δ) vs. xenon concentration, C, for the amide proton resonances of residues Asp12, Arg18, Ile20, and Asp57, which line the H1-β3 cavity, for the apo (○, solid line) and the activated (•, dashed line) forms of CheY. (B) The average of the normalized change in chemical shift (Δ δ) vs. xenon concentration, C, for the amide proton resonances of residues Tyr106 and Val107, which line the β4-H4 cavity, for the apo (□, solid line) and activated (▪, dashed line) conformations of CheY. Chemical shift changes were normalized according to the limiting shift obtained by an initial fit for each residue. These normalized values were averaged for residues unique to the two cavities to obtain the data and error bars shown in this figure. The respective binding constants obtained from these fits are shown in Table 2. Unlike the H1-β3 cavity, the xenon binding affinity of the β4-H4 cavity changes with activation.