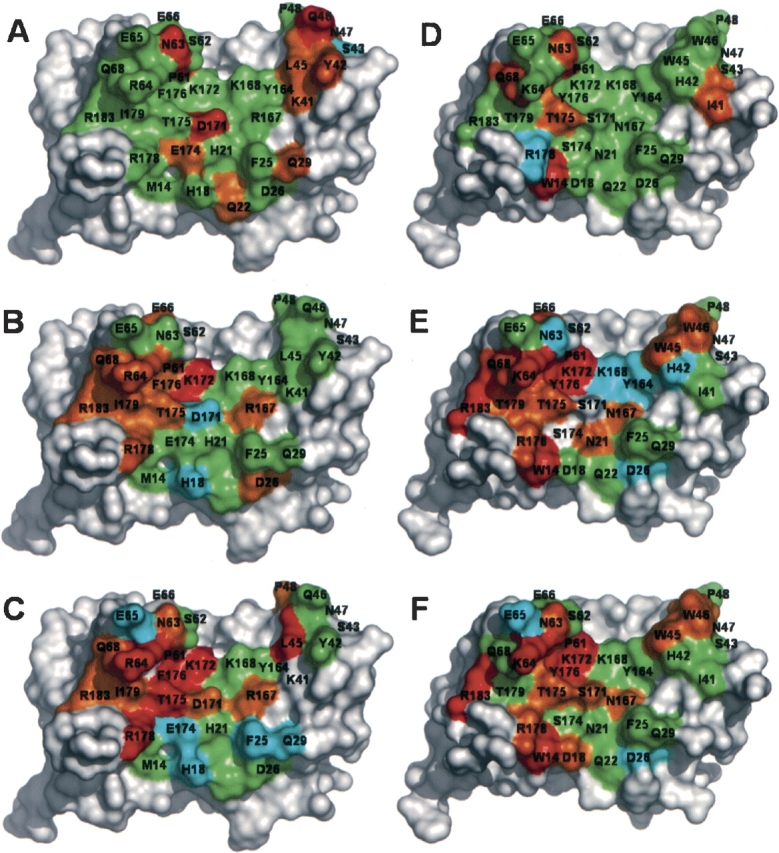
Figure 2.

The effects of mutations on site 1 binding affinity for the hGHR mapped onto the structure of hGHwt (A–C) or hGHv (D–F). The maps show the effects of substitution by homologous residues (A,D), serine (B,E), or alanine (C,F). The residues are colored according to the ΔΔGmut-wt values shown in Table 2 and Figure 1 ▶, as follows: cyan< −0.4 kcal/mol; −0.4 kcal/mol ≤ green<0.4 kcal/mol; 0.4 kcal/ mol ≤ orange<1.0 kcal/mol; red ≥ 1.0 kcal/mol; gray, untested. The structures were derived from the 2:1 hGHR-ECD:hGH complexes for hGHwt (de Vos et al. 1992) and hGHv (Schiffer et al. 2002), and were rendered as molecular surfaces using Pymol (DeLano Scientific).
