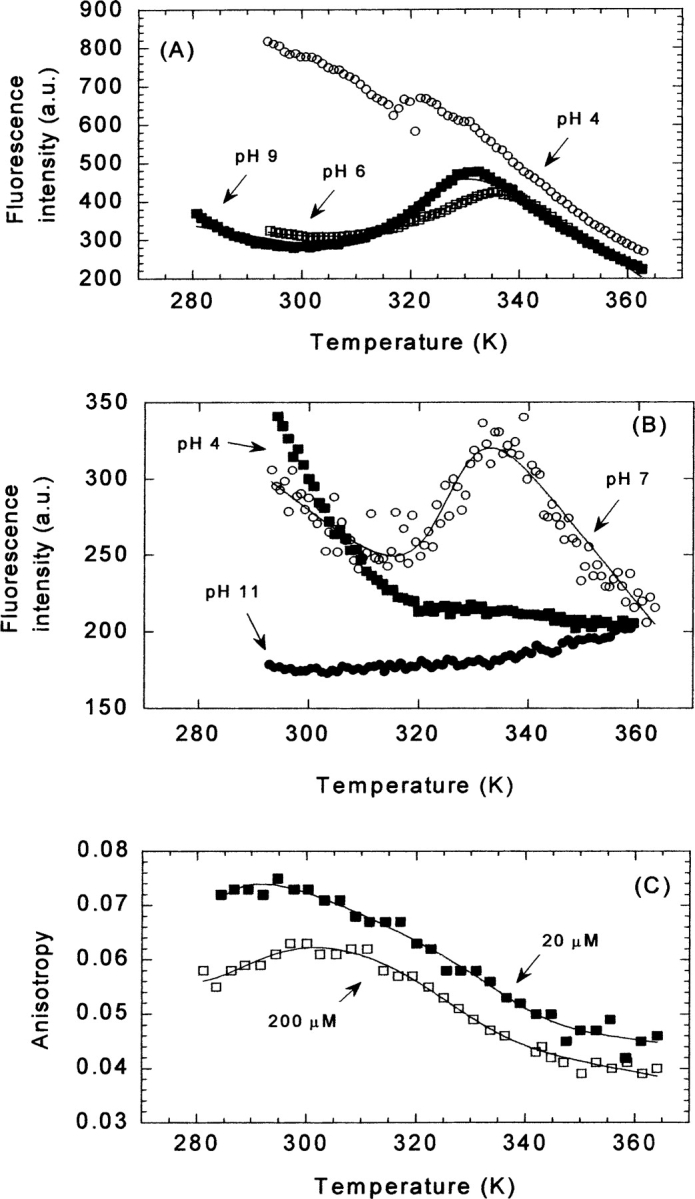
Figure 5.

Thermal denaturation followed by protein fluorescence, ANS fluorescence, and anisotropy at different pHs. (A) Thermal unfolding traces followed by fluorescence at selected pHs for 200 μM of CA-C: pH 4 (open circles), pH 6 (white squares), and pH 9 (filled squares). (B) The thermal denaturation experiments followed by the emission intensity at 520 nm of 20 μM CA-C and 100 μM of ANS at several pHs: pH 4 (filled squares), pH 7 (open circles), and pH 11 (filled circles). The scale on the Y-axis for both fluorescence measurements is arbitrary. (C) The change in anisotropy at 20 μM (filled squares) and 200 μM of CA-C (blank squares) at pH 7. The lines are the fittings to Equation 6, taking into account that the free energy is given by Equation 7.
