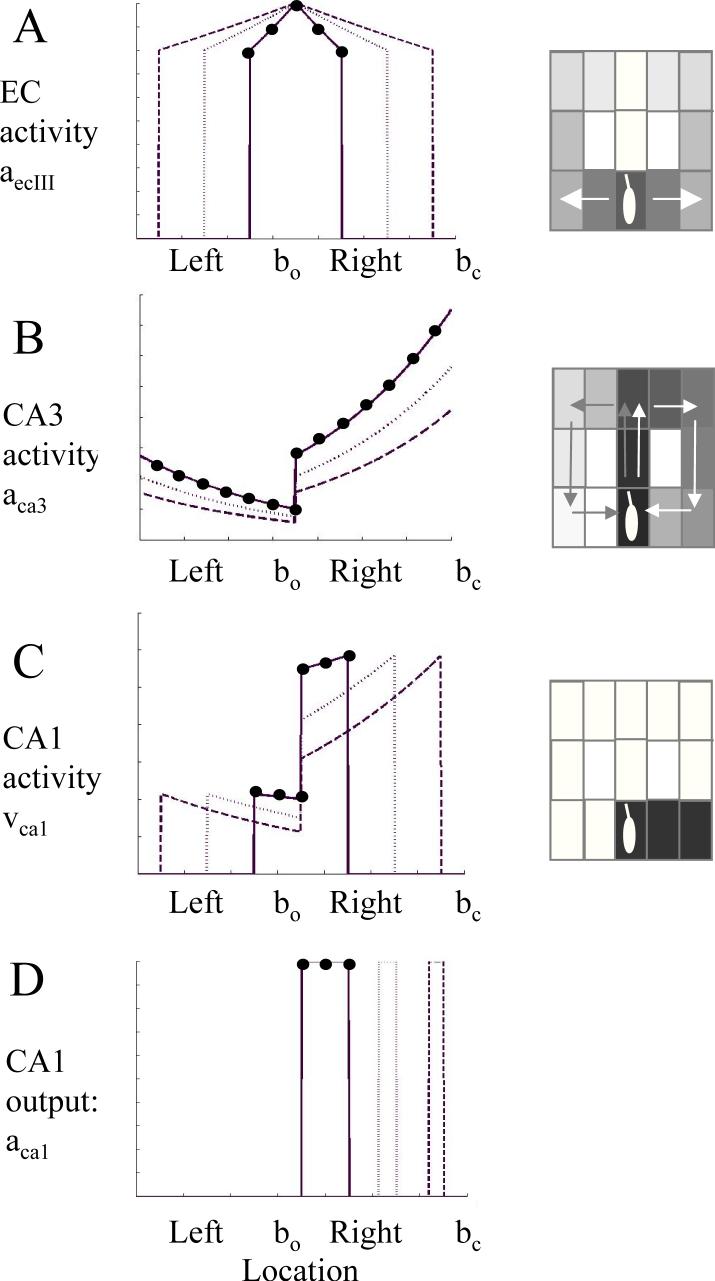
Figure 10.
Simplified example of activity in different units in the hippocampal model during multiple time steps in a single state. The y axis shows magnitude of activity in different regions. The x axis indicates individual units representing the choice point (bo) as well as the left and right arms (x axis). To make curves clearer, parameters differed from other simulations, using η=0.8, μ=0.75, , ε=0.000001, and ψca1=0.1335. Different lines show magnitude of activity at different times during retrieval (ϕ=0) (solid: t=2, dotted: t=4, dashed: t=6. For t=2, unit activity is marked with black circles). Boxes on the right show gray scale depictions of the locations in the T-maze being represented by activity in the model (note that spread in this example is longer than in other simulations). A. Magnitude of input from entorhinal cortex (equation 2). EC activity spreads equally along previous stored forward associations, activating neurons representing both the left and right arm of the maze. The distance of suprathreshold spread increases as t increases. B. Magnitude input from region CA3 to region CA1 (equation 5). The magnitude of input is strongest for neurons representing current context bc, and decreases exponentially for previously visited states, such that the locations visited recently in the right arm have stronger temporal context than the locations visited earlier in the left arm. Magnitude of temporal context decreases as t increases. C. Magnitude of multiplication of inputs in region CA1. Curves have same maximal amplitude for different events in the recent episode, and lower maximal amplitude for events in the more remote episode. D. Thresholded output of CA1. Thresholding with a constant threshold or on the basis of previous activity allows sequential read-out of spiking in CA1 representing just one of the retrieved sequences.

