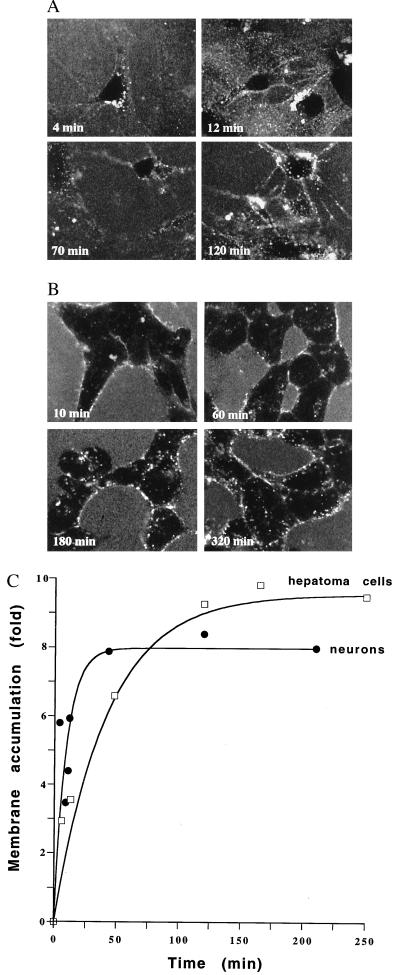
Figure 1.
Visualization of fluorescently labeled Vpr at various times after addition to rat hippocampal neurons (A) and HTC cells (B) using a CLSM. Quantitation of membrane accumulation of fluorescently labeled Vpr compared with medium concentrations over time for hippocampal neurons and HTC cells is shown in C. Each point represents four or five measurements performed with a line plot for each of membrane and medium fluorescence, subsequent to the subtraction of background fluorescence (quantitated in samples lacking fluorescently labeled Vpr) where the SEM for individual measurements was less than 11.6 and 10.9% of the value of the mean for neurons and HTC cells, respectively.

