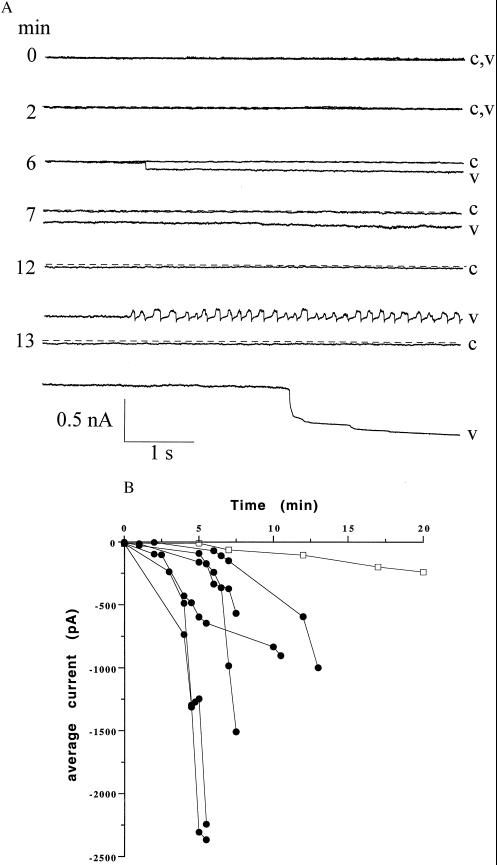
Figure 2.
(A) Typical whole-cell responses from a single cell held at −60 mV after exposure to Vpr for 15 min. The dotted line represents the control whole-cell current before treatment with Vpr. Traces of 6-s recordings in response to CHAPS (c) and Vpr (v) are shown at different times. (B) Whole-cell currents at −60 mV of six individual cells after exposure to Vpr (•) or CHAPS (□) at various times.

