
FIGURE 1—
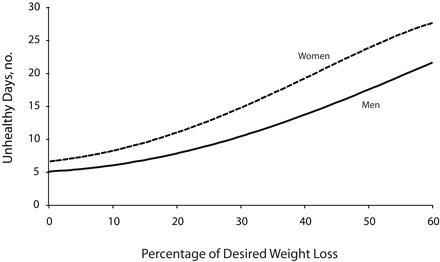
The relationship between the percentage of desire weights loss and total unhealthy days per month among US adults by gender: Behavioral Risk Factor Surveillance System, 2003.
Note. Percentage of desired weight loss was the difference between actual body weight and the body weight perceived by the participant to be ideal. At values greater than zero, women had more unhealthy days and the slope of the curve increased more sharply than for men. The formula used to calculate percentage of desired weight loss is in the “Methods” section.