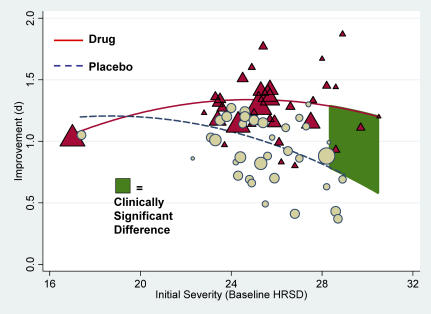
Figure 2. Mean Standardized Improvement as a Function of Initial Severity and Treatment Group.
Drug improvement is portrayed as red triangles around their solid red regression line and placebo improvement as blue circles around their dashed blue regression line; the green shaded area indicates the point at which comparisons of drug versus placebo reach the NICE clinical significance criterion of d = 0.50. Plotted values are sized according to their weight in analyses.

