
FIG. 1.
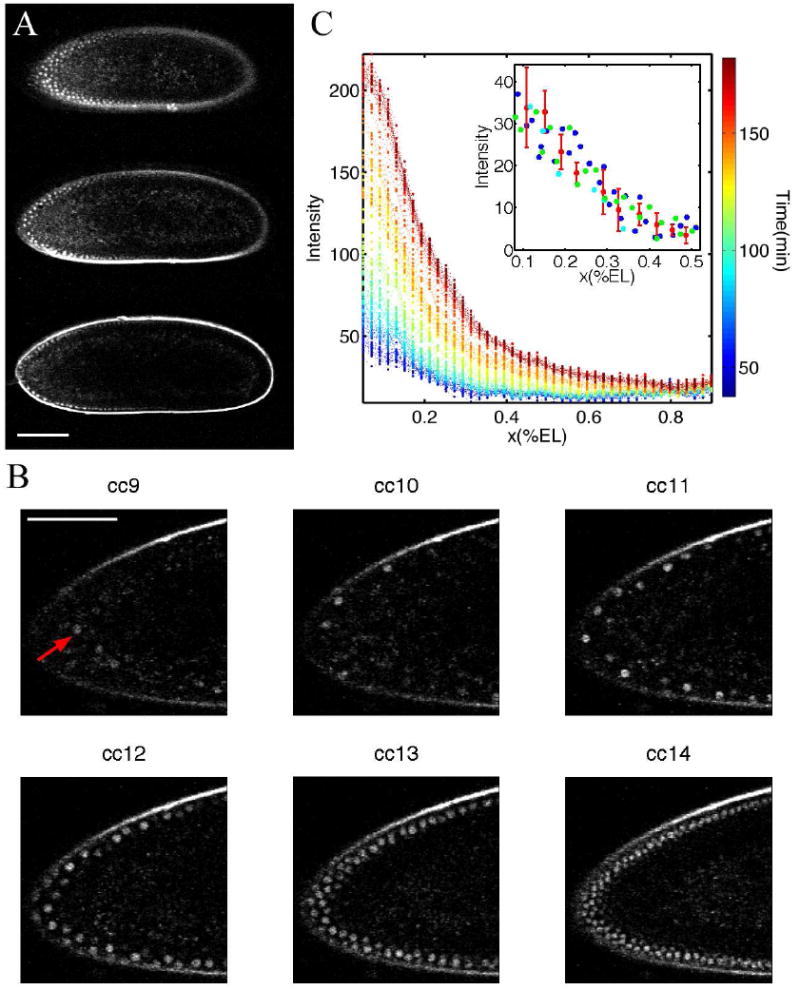
Time-lapse movie of a Drosophila embryo expressing Bcd-GFP using two-photon microscopy. A Typical image stack during nuclear cycle 12 of three focal planes at 30 μm (top panel), 60 μm (mid panel) and 90 μm (bottom panel) below the top surface of the embryo. (Scale bar 100 μm.) B Six snapshots of a time-lapse movie of the anterior third of the mid-sagittal plane of a Drosophila embryo expressing Bcd-GFP. Each snapshot corresponds to a time point during interphases 9 to 14. Red arrow points to individual nucleus during interphase 9 when nuclei are deeper inside the egg. (Scale bar 60 μm.) C Bcd-GFP fluorescence profiles are extracted from two-photon time-lapse movies and projected on the egg’s AP-axis by sliding (in software) an averaging box of 10 × 10 μm2 size along the edge of the egg focussed at the mid-sagittal plane. Time is represented by colorcode. Time zero corresponds to oviposition. Imaging started 20 ± 15 min after oviposition. Inset: Nuclear Bcd gradients in nuclear cycles 11 (blue), 12 (green), 13 (red) and 14 (cyan) projected on the AP-axis in the anterior half of the embryo.