
FIG. 2.
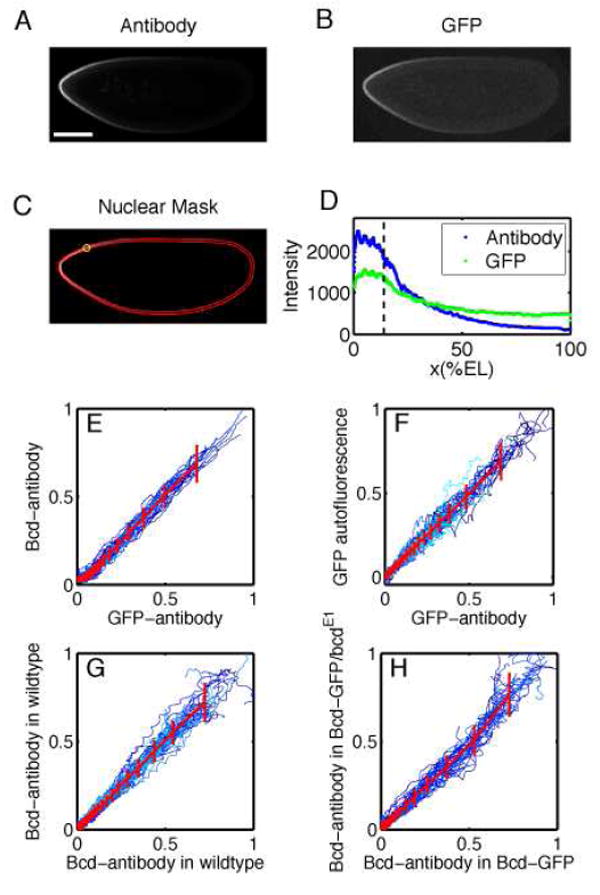
Comparison of Bcd profiles in Drosophila embryos expressing Bcd-GFP. (Embryos were formaldehyde fixed during nuclear cycle 14 and imaged at the mid-sagittal plane via confocal microscopy.) A Embryo stained with GFP antibodies.(Scale bar 100 μm.) B GFP autofluorescence for the same embryo as in A. C Nuclear layer obtained via image analysis software used to extract gradients from images A and B by sliding a circular averaging area (yellow circle) along the edge of the embryo images. D Extracted raw gradients from A and B projected on embryo AP-axis. Dashed line corresponds to location of yellow circle in C. E-H Scatter plots of fluorescence intensities extracted from Bcd profiles for different embryos. All profiles were normalized by a background subtraction and a scale factor (see Materials and Methods). Both dorsal and ventral profiles are shown in each panel. Colors represent individual embryos, red lines correspond to the average profile scatter, errorbars are for equal amounts of data points. Deviations of the compared profiles from the diagonal indicate a difference in the shape of the profile. For more information see Supplemental Data.