
FIG. 5.
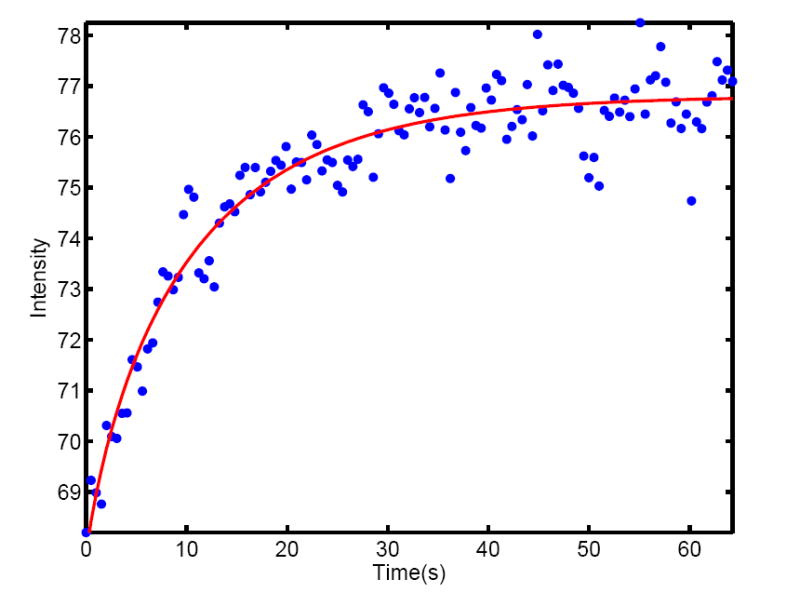
Cortical diffusion constant measurements by fluorescence recovery after photobleaching. Recovery curve of bleached wild-type Drosophila embryos expressing Bcd-GFP during mitosis 13. Bleaching was done with a scanning two-photon microscope in a volume of 16 × 16 × 7 μm3 at the anterior tip of the egg. The bleaching pulse was generated by increasing the laser power 2-fold for a duration of 5 seconds. Data points are spaced 0.5 sec and shown as blue dots. Red curve represent a fit to the solution of the diffusion equation (see Methods), yielding a diffusion constant D = 0.27 ± 0.07 μm2/s.