
FIG. 6.
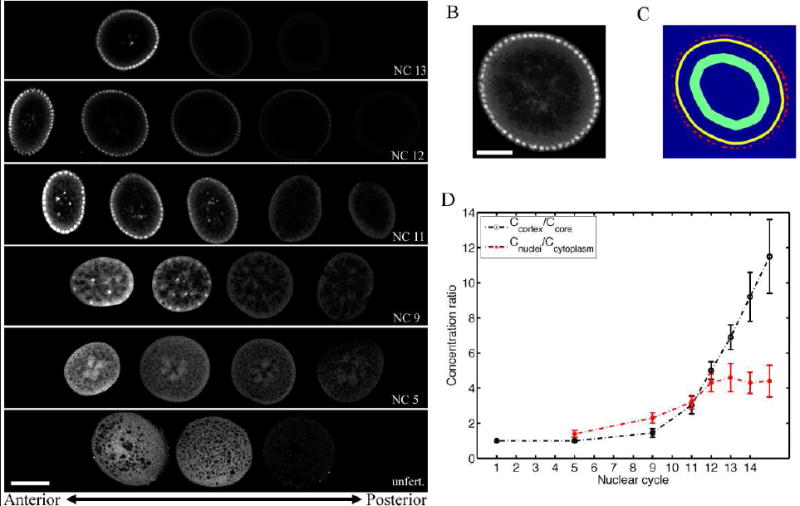
Bcd concentration accumulation at the egg’s cortex. A Confocal images of hand-cut sections of formaldehyde-fixed wild-type Drosophila embryos. (Scale bar 100 μm.) Embryos have been stained with Bcd antibodies prior to cutting. Each row corresponds to a single embryo with sections ordered from anterior (left) to posterior (right) parts of the embryo during nuclear cycles 13, 12, 11, 9 and 5 (top to bottom). Bottom row shows a Bcd antibody staining of an unfertilized egg. B Typical anterior slice of hand-cut embryo stained with Bcd antibodies (close up of second slice from the right in 2nd row of A, scale bar 50 μm.). C Mask used to extract concentration averages in B. Red area corresponds to nuclear mask, yellow area corresponds to cytoplasmic mask and green area corresponds to core area. D Ratio of cytoplasmic Bcd concentration in the cortex and the inner core of the egg (black curve), and ratio of nuclear Bcd concentration and adjacent cytoplasmic Bcd concentration (red curve), both as a function of nuclear cycle. Concentrations are extracted from cut sections of A.