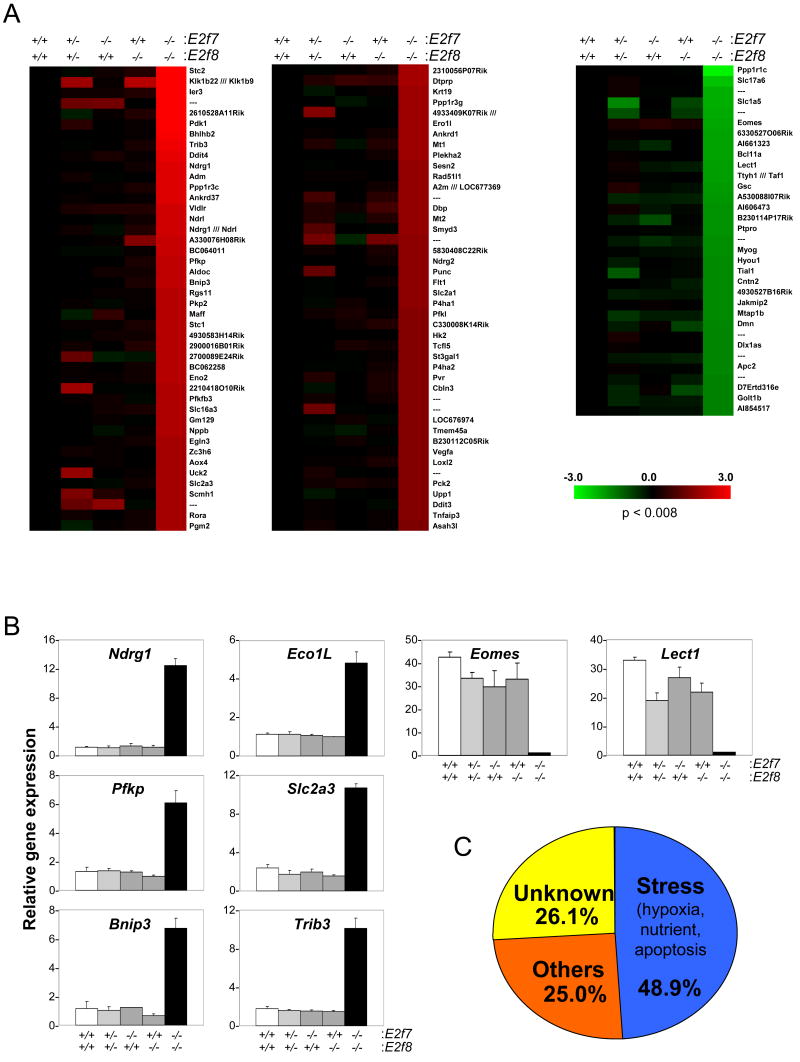
Figure 6.
Microarray analysis of E10.5 embryos. (A) Heat maps of probe sets in Affymetrix microarrays that showed at least a 3-fold induction (left and middle) or a 3-fold reduction (right) of expression in E2f7-/-E2f8-/- relative to wild type embryos. Data are presented as the medium of 4 embryos from wild type, E2f7-/-E2f8+/+ and E2f7+/+E2f8-/- genotype groups, and the medium of 2 embryos from E2f7+/-E2f8+/- and E2f7-/-E2f8-/- genotype groups. Red and green indicate induction and reduction respectively. Probe sets representing genes of interest are indicated. (B) The expression of 8 target genes (6 up-regulated and 2 down-regulated) was evaluated by real-time RT-PCR assays. (C) Pie chart diagrams illustrate the non-random distribution of the stress-related genes among the total 88 up-regulated genes in DKO embryos.

