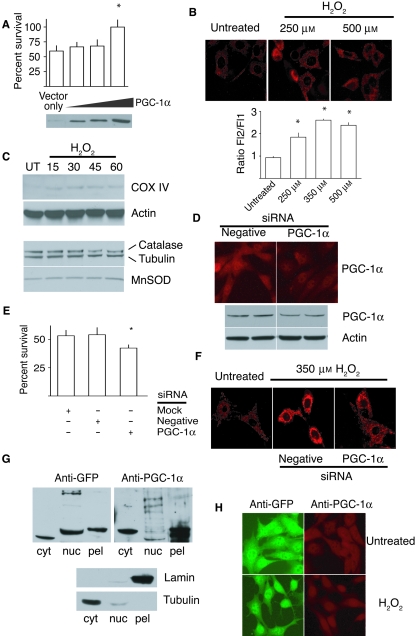
Fig. 1.
PGC-1α regulates mitochondrial function in response to stress. (A) Percent survival of NIH3T3 fibroblasts after treatment with H2O2 (350 µm); values represent means ± standard error of the mean (SEM); * indicates significant difference in survival compared to vector control (P < 0.05). (B) MitoTracker Red or JC-1 measurement of mitochondrial membrane potential in 1 h of H2O2treatment at indicated doses. Higher ratio of Fl2/Fl1 is indicative of higher membrane potential. Values represent means ± SEM; * indicates significant difference compared to untreated (P < 0.05). (C) Western analysis of COX IV, catalase and MnSOD in cell lysates taken at indicated times following exposure to hydrogen peroxide (350 µm). (D) PGC-1α RNA interference specifically reduces the level of PGC-1α as detected by immunofluorescence and Western blot. (E) Percent survival in cells exposed to H2O2 (350 µm, 1 h). Values represent means ± SEM; * indicates significant difference in survival compared to mock treatment and negative control (P < 0.05). (F) Mitochondrial membrane potential detected using Mitotracker Red in cells exposed to H2O2 (350 µm, 1 h). (G) Western blot to detect GFP or PGC-1α in equivalent relative amounts of protein from cytoplasmic and nuclear extracts, a four times equivalent of the insoluble nuclear pellet was loaded to facilitate detection. (H) Immunofluorescent detection of PGC-1α in cells over-expressing GFP-tagged PGC-1α and grown in the absence or presence of H2O2 (350 µm, 45 min) using anti-GFP or anti-PGC-1α antibodies.

