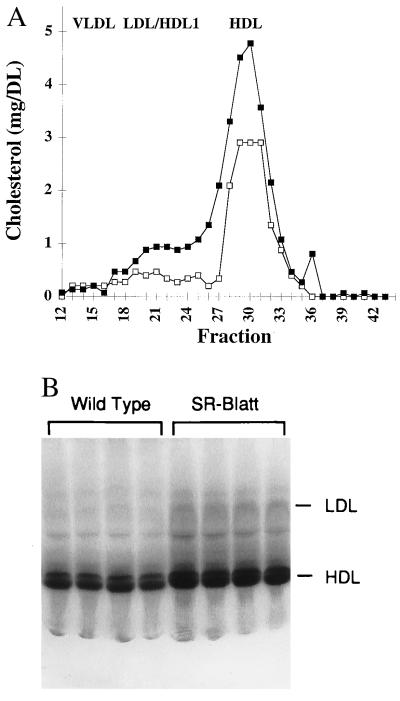
Figure 3.
Plasma cholesterol and HDL analysis. (A) FPLC analysis of plasma lipoproteins. Plasma was pooled (n = 4) from homozygous mutant (▪) and control (□) female mice (ages 10, 11.5, and 15.5 weeks, and 11.5 and 15.5 weeks, respectively) and subjected to FPLC Superose-6 gel filtration, and the cholesterol content of the fractions was determined. (B) Nondenaturing PAGE of plasma from control and mutant mice. Ten microliters of plasma from control and SR-BI att male mice were analyzed.

