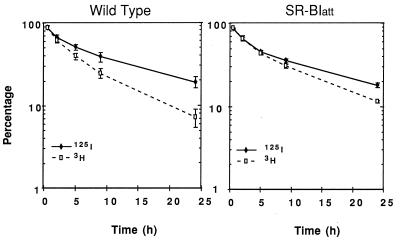
Figure 5.
Plasma decay curves for 125I-NMTC/[3H]CEt-labeled HDL. Mice were injected with labeled HDL, blood was collected periodically over 24 h, and plasma content of both tracers was determined as described in Materials and Methods. The values are means ± SEM of each of the n = 4 control and SR-BI att mice.

