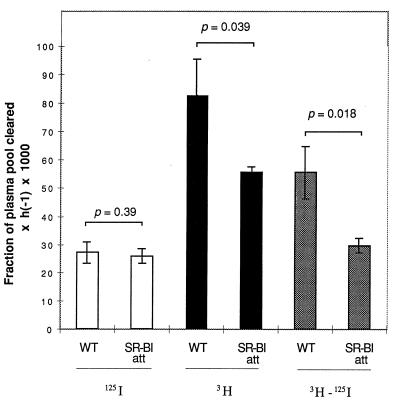
Figure 6.
Uptake of labeled HDL by the liver. Liver FCRs, calculated as described in Materials and Methods, are shown for uptake of labeled protein (125I, open bars) and cholesteryl ether (3H, solid bars). The shaded bars represent selective CE uptake (3H − 125I). Significance was determined by Student’s one-tailed t test for unpaired data.

