
Figure 2.
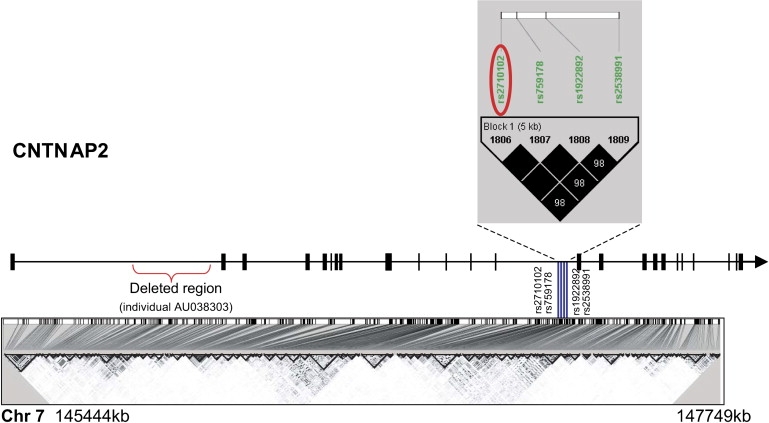
Relative Location of Associated SNPs within CNTNAP2
Gene structure is depicted from 5′ to 3′ with exons represented by small blocks or lines along the gene, and the black arrowhead indicates gene direction. The SNPs that comprised the nominally significant (p < 0.01) block 254 from Stage 1 are represented by blue vertical lines over the bottom LD plot. The tag SNP, rs2710102, confirmed in the male-only trios (n = 187) in Stage 2 is circled in red. The LD plot was generated with the Haploview program.