
Figure 2.
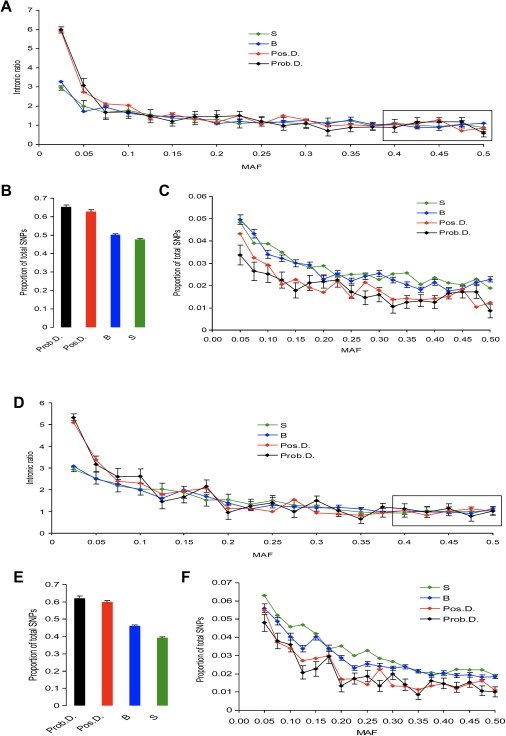
Distribution of Intronic Ratios and MAFs for Various Types of the HapMap SNPs in Coding Regions of the Human Genome: S, B, Pos.D., and Prob.D. SNPs
(A)–(C) show the CEPH (Europeans) sample; (D)–(F) show the YRI (Africans) sample. (A) and (D) show intronic ratios for synonymous SNPs (S), nonsynonymous SNPs predicted to be benign (B), nsSNPs predicted to be possibly damaging (Pos.D.), and nsSNPs predicted to be probably damaging (Prob.D.). Absolute numbers of S, B, Pos.D., and Prob.D. SNPs varied drastically, thereby making direct comparisons of intronic ratios difficult. For visual clarity, we scaled the average ratios to 1 by anchoring the distributions by their rightmost parts (i.e., 0.4–0.5). Standard errors (SEs) are shown for S and Prob.D. SNPs. (B) and (E) show the distribution of SNPs with 0–0.025 MAFs. The proportion of SNPs in the 0–0.025 MAF category is shown separately because it was much greater than proportions in the other categories. MAF was portioned into 20 bins by a 2.5% step. (C) and (F) show the proportion of SNPs in MAF >0.025 categories.