
Figure 7.
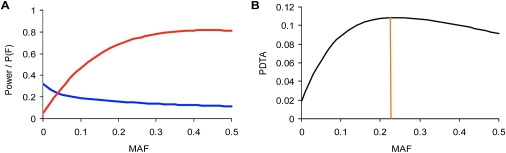
Example of Computing Probability to Detect True Association and Most Powerful Minor Allele Frequency
Study of single-nucleotide polymorphisms in a dominant model of inheritance with 300 cases and 300 controls. An OR = 1.5 was assumed. In (A), the red line shows the dependence of the statistical power on minor allele frequency (MAF), and the blue line shows the predicted proportion of functional SNPs P(F), predicted by formula 1. (B) shows the dependence of PDTA on MAF. The mpMAF is marked by the vertical line, which indicates ∼0.22 in this case.