
Figure 2.
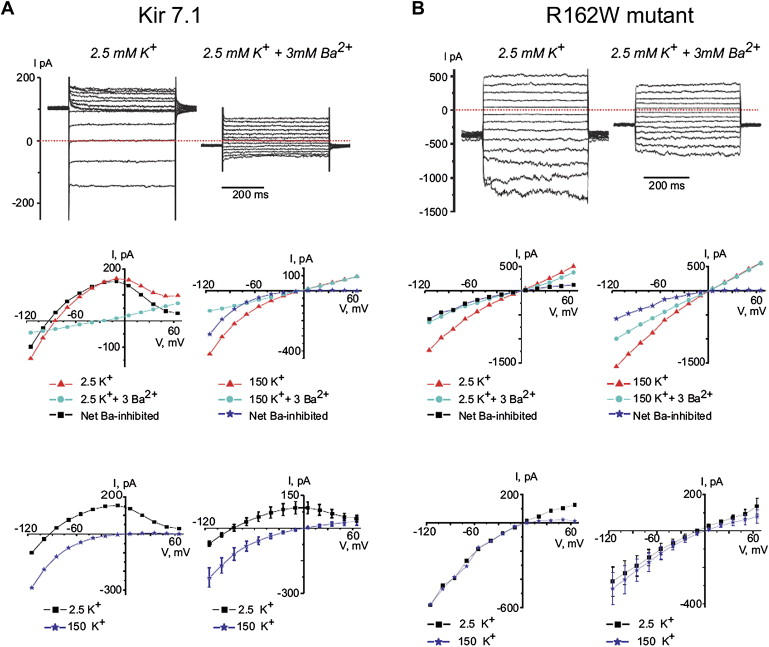
Electrophysiological Properties of Normal and Mutant Rat Kir7.1 Expressed in CHO Cells
The top line show examples of currents measured in Kir7.1 (A) or R162W mutant Kir7.1 (B) transfected CHO cells in response to voltage-clamp steps from the holding potential −50 mV to voltages between −115 mV and 65 mV. The middle-left (2.5 K) and -right (150K) panels show single-experiment examples of I-V relations measured in cells expressing Kir 7.1 (A) and R162W mutant Kir7.1 (B). The mean current measured isochronally between 250 ms and 450 ms of the 500 ms pulse is shown. The net Ba2+ inhibited current differs between the normal and mutant Kir7.1 both in the shape of the curve and its reversal potential (the point at which it crosses the abscissa). The bottom-left panels show superimposed traces from the middle panels, and the bottom-right panels show mean data comparing normal ([A], n = 10 cells from three experiments) and R162W mutant ([B], n = 13 cells per three experiments) Kir7.1. In the R162W mutant, the 2.5K current has lost its potassium selectivity (Er = −9 mV), has a less pronounced inwardly rectifying quality, and appears qualitatively similar to the 150K current in both normal and mutant molecules. Transfected cells showing increased leak current (I > 800 pA at 50 mV; n = 1 and n = 136 for cells transfected with Kir 7.1 and R162W mutant, respectively) were omitted from analysis.