
Figure 1.
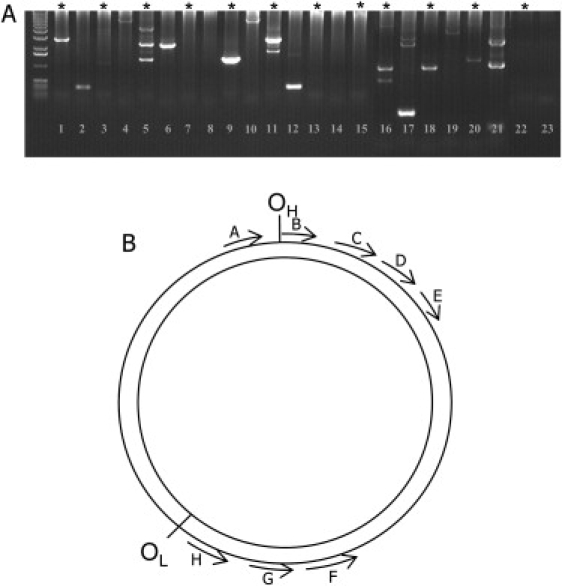
An Agarose Gel Displaying a Typical Long-Range PCR of Substantia Nigra Neurons
(A) A typical agarose gel displaying the different sized mtDNA deletions that have been amplified with long-range PCR on DNA from single neurons. This gel shows the products from a second-round PCR, and each lane represents a PCR from a single cell. In some cells, it is possible to detect multiple deletions. Lanes 1, 2, 9, and 10 show deletions detected in a cell from an aged individual, lanes 5 and 6 show deletions detected in a cell from a PD patient, lanes 11,12, and 16–21 show deletion detected within cells from the patient with multiple mtDNA deletions, and lanes 22 and 23 show negative controls. Those cells marked with an ∗ indicate products from a 9 kb PCR, whereas the remaining lanes are the product of a 6 kb PCR.
(B) A representation of the positions of the primer pairs used in this study. Primer pairs C (15896–15877) and H (5855–5875) were used for the generation of the 10 kb first round PCR, primer pairs D (15368–15348) and G (6358–6377) the 9 kb second round, and primer pairs E (13859–13839) and F (7272–7293) the 6 kb second round. Primer pairs A (129–110) and H (5855–5875) were used for the generation of the first-round PCR products for the 16070 bp assay and primer pairs B (019–001) and G (6358–6377) the second round products of this assay.