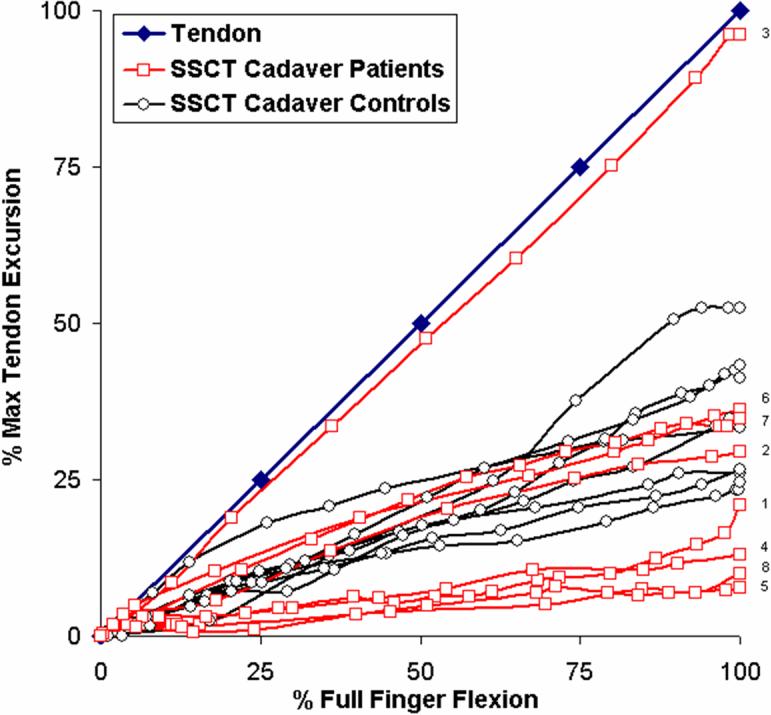
Figure 5.

Movement of the tendon (blue) and SSCT of the eight cadaver CTS hands (red) versus the eight cadaver control hands (black) as a percentage of each maximum tendon movement. Four out of the eight cadaver CTS hands show a decreased displacement as compared to the controls. Three cadaver patients moved similar to the controls. Number 1−8 represent individual specimens.
